Xylem Inc.'s (NYSE:XYL) Stock's Been Going Strong: Could Weak Financials Mean The Market Will Correct Its Share Price?
Xylem's (NYSE:XYL) stock is up by a considerable 15% over the past three months. However, we decided to pay close attention to its weak financials as we are doubtful that the current momentum will keep up, given the scenario. Specifically, we decided to study Xylem's ROE in this article.
ROE or return on equity is a useful tool to assess how effectively a company can generate returns on the investment it received from its shareholders. In other words, it is a profitability ratio which measures the rate of return on the capital provided by the company's shareholders.
View our latest analysis for Xylem
How Is ROE Calculated?
The formula for return on equity is:
Return on Equity = Net Profit (from continuing operations) ÷ Shareholders' Equity
So, based on the above formula, the ROE for Xylem is:
6.0% = US$609m ÷ US$10b (Based on the trailing twelve months to December 2023).
The 'return' refers to a company's earnings over the last year. So, this means that for every $1 of its shareholder's investments, the company generates a profit of $0.06.
What Has ROE Got To Do With Earnings Growth?
We have already established that ROE serves as an efficient profit-generating gauge for a company's future earnings. Depending on how much of these profits the company reinvests or "retains", and how effectively it does so, we are then able to assess a company’s earnings growth potential. Assuming everything else remains unchanged, the higher the ROE and profit retention, the higher the growth rate of a company compared to companies that don't necessarily bear these characteristics.
Xylem's Earnings Growth And 6.0% ROE
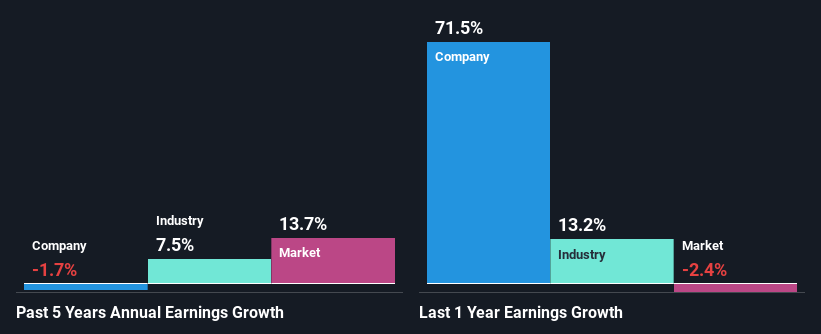
On the face of it, Xylem's ROE is not much to talk about. A quick further study shows that the company's ROE doesn't compare favorably to the industry average of 13% either. Therefore, Xylem's flat earnings over the past five years can possibly be explained by the low ROE amongst other factors.
Next, on comparing with the industry net income growth, we found that the industry grew its earnings by 7.5% over the last few years.
The basis for attaching value to a company is, to a great extent, tied to its earnings growth. It’s important for an investor to know whether the market has priced in the company's expected earnings growth (or decline). Doing so will help them establish if the stock's future looks promising or ominous. If you're wondering about Xylem's's valuation, check out this gauge of its price-to-earnings ratio, as compared to its industry.
Is Xylem Making Efficient Use Of Its Profits?
The high three-year median payout ratio of 53% (meaning, the company retains only 47% of profits) for Xylem suggests that the company's earnings growth was miniscule as a result of paying out a majority of its earnings.
In addition, Xylem has been paying dividends over a period of at least ten years suggesting that keeping up dividend payments is way more important to the management even if it comes at the cost of business growth. Existing analyst estimates suggest that the company's future payout ratio is expected to drop to 31% over the next three years. Accordingly, the expected drop in the payout ratio explains the expected increase in the company's ROE to 10%, over the same period.
Conclusion
Overall, we would be extremely cautious before making any decision on Xylem. The company has seen a lack of earnings growth as a result of retaining very little profits and whatever little it does retain, is being reinvested at a very low rate of return. That being so, the latest industry analyst forecasts show that the analysts are expecting to see a huge improvement in the company's earnings growth rate. To know more about the latest analysts predictions for the company, check out this visualization of analyst forecasts for the company.
Have feedback on this article? Concerned about the content? Get in touch with us directly. Alternatively, email editorial-team (at) simplywallst.com.
This article by Simply Wall St is general in nature. We provide commentary based on historical data and analyst forecasts only using an unbiased methodology and our articles are not intended to be financial advice. It does not constitute a recommendation to buy or sell any stock, and does not take account of your objectives, or your financial situation. We aim to bring you long-term focused analysis driven by fundamental data. Note that our analysis may not factor in the latest price-sensitive company announcements or qualitative material. Simply Wall St has no position in any stocks mentioned.
