Xylem Inc's Dividend Analysis
Exploring the Sustainability and Growth of Xylem Inc's Dividends
Xylem Inc (NYSE:XYL) recently announced a dividend of $0.36 per share, payable on 2024-03-20, with the ex-dividend date set for 2024-02-20. As investors look forward to this upcoming payment, the spotlight also shines on the company's dividend history, yield, and growth rates. Using the data from GuruFocus, let's look into Xylem Inc's dividend performance and assess its sustainability.
What Does Xylem Inc Do?
This Powerful Chart Made Peter Lynch 29% A Year For 13 Years
How to calculate the intrinsic value of a stock?
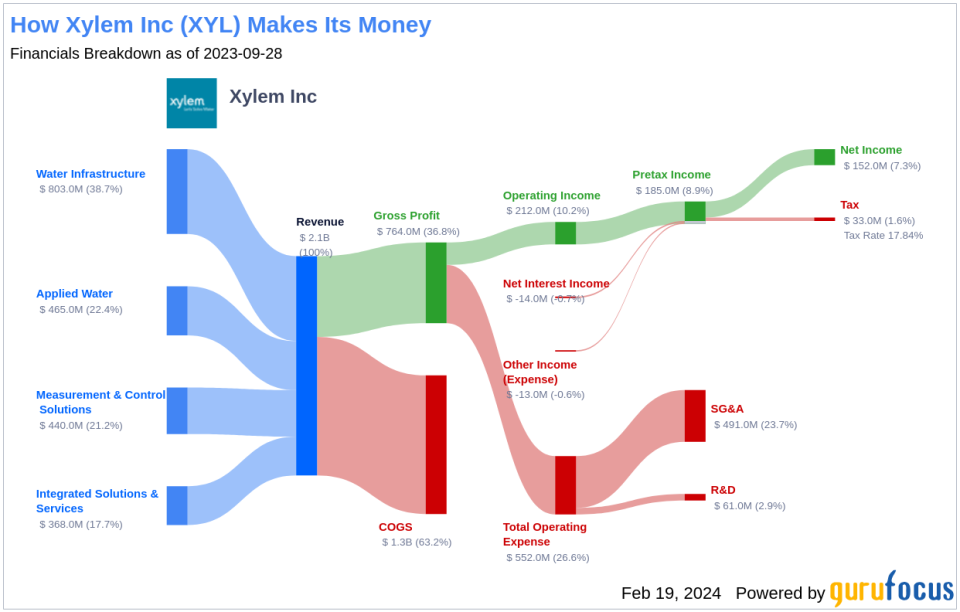
Xylem is a global leader in water technology and offers a wide range of solutions, including the transport, treatment, testing, and efficient use of water for customers in the utility, industrial, commercial, and residential sectors. Xylem was spun off from ITT in 2011. Based in Rye Brook, New York, Xylem has a presence in over 150 countries and employs 16,200. The company generated $7.4 billion in revenue in 2023.
A Glimpse at Xylem Inc's Dividend History
Xylem Inc has maintained a consistent dividend payment record since 2011, distributing dividends on a quarterly basis. The company has also increased its dividend each year since its inception, earning it the status of a dividend achiever, a prestigious recognition for companies with at least 13 consecutive years of dividend increases.
Below is a chart showing the annual Dividends Per Share for tracking historical trends.
Breaking Down Xylem Inc's Dividend Yield and Growth
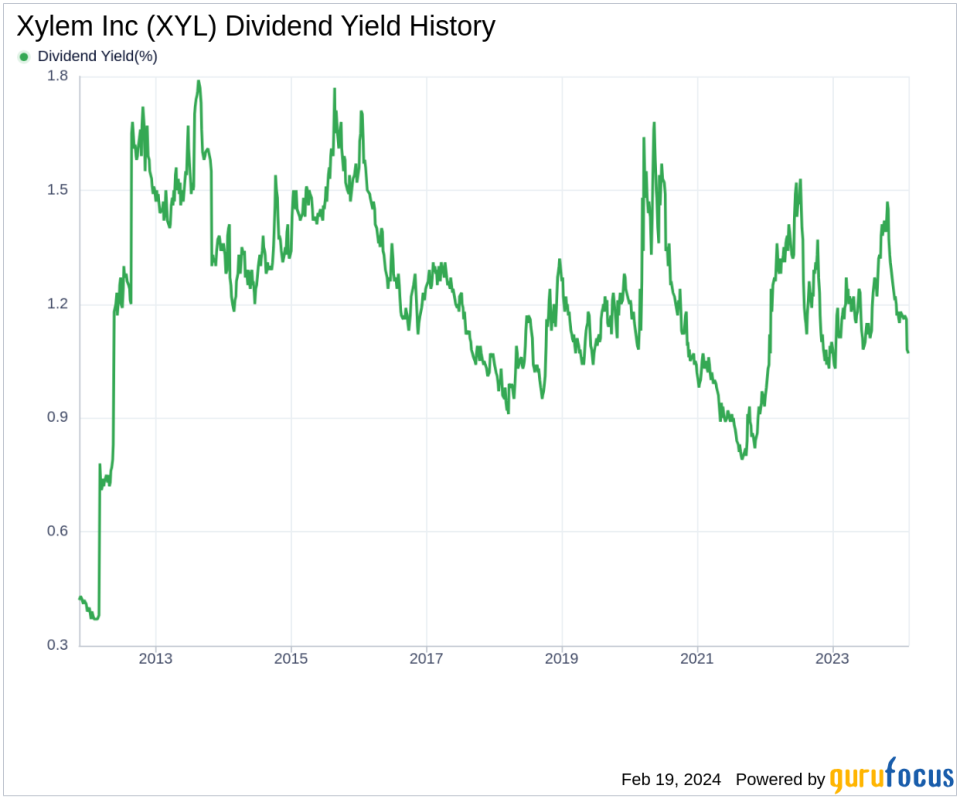
As of today, Xylem Inc currently has a 12-month trailing dividend yield of 1.07% and a 12-month forward dividend yield of 1.16%, indicating an expectation of increased dividend payments over the next year.
Over the past three years, Xylem Inc's annual dividend growth rate was 8.30%. This rate increased to 9.00% per year over a five-year period, and over the past decade, the annual dividends per share growth rate stands at an impressive 11.50%.
Based on Xylem Inc's dividend yield and five-year growth rate, the 5-year yield on cost for Xylem Inc stock as of today is approximately 1.65%.
The Sustainability Question: Payout Ratio and Profitability
To assess the sustainability of the dividend, one needs to evaluate the company's payout ratio. The dividend payout ratio provides insights into the portion of earnings the company distributes as dividends. As of 2023-12-31, Xylem Inc's dividend payout ratio is 0.36, suggesting a sustainable dividend policy.
Xylem Inc's profitability rank of 7 out of 10, combined with a decade of positive net income, indicates good profitability prospects and a solid foundation for future dividend payments.
Growth Metrics: The Future Outlook
Xylem Inc's growth rank of 7 out of 10 suggests a positive growth trajectory relative to competitors. The company's average annual revenue increase of 7.80% outperforms approximately 52.6% of global competitors, indicating a strong revenue model.
The 22.40% average annual increase in Xylem Inc's earnings over the past three years outperforms approximately 65.05% of global competitors, highlighting the company's ability to grow earnings. Additionally, the 5-year EBITDA growth rate of 4.00% outperforms approximately 39.67% of global competitors, further supporting the sustainability of dividends.
Concluding Thoughts on Xylem Inc's Dividend Prospects
In conclusion, Xylem Inc's consistent dividend history, above-average growth rates, manageable payout ratio, and strong profitability and growth metrics paint a positive picture for the company's dividend prospects. As investors consider the next dividend payment, these factors offer reassurance about the sustainability and potential growth of Xylem Inc's dividends. For those seeking to explore further, GuruFocus Premium provides tools like the High Dividend Yield Screener to identify high-dividend yield stocks.
This article, generated by GuruFocus, is designed to provide general insights and is not tailored financial advice. Our commentary is rooted in historical data and analyst projections, utilizing an impartial methodology, and is not intended to serve as specific investment guidance. It does not formulate a recommendation to purchase or divest any stock and does not consider individual investment objectives or financial circumstances. Our objective is to deliver long-term, fundamental data-driven analysis. Be aware that our analysis might not incorporate the most recent, price-sensitive company announcements or qualitative information. GuruFocus holds no position in the stocks mentioned herein.
This article first appeared on GuruFocus.
