Y-mAbs Therapeutics, Inc. (NASDAQ:YMAB) Surges 104% Yet Its Low P/S Is No Reason For Excitement
Y-mAbs Therapeutics, Inc. (NASDAQ:YMAB) shares have had a really impressive month, gaining 104% after a shaky period beforehand. Unfortunately, the gains of the last month did little to right the losses of the last year with the stock still down 47% over that time.
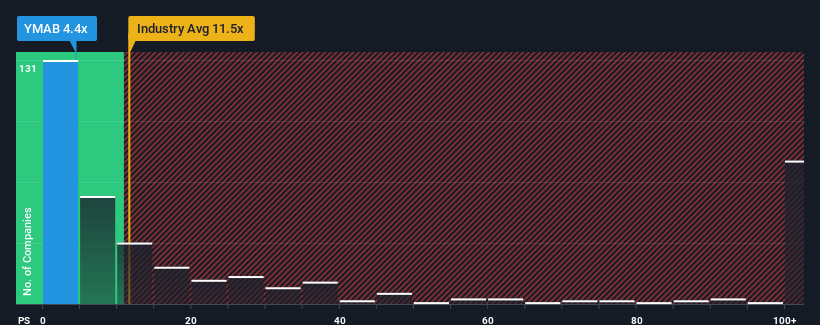
In spite of the firm bounce in price, Y-mAbs Therapeutics' price-to-sales (or "P/S") ratio of 4.4x might still make it look like a strong buy right now compared to the wider Biotechs industry in the United States, where around half of the companies have P/S ratios above 11.5x and even P/S above 50x are quite common. Nonetheless, we'd need to dig a little deeper to determine if there is a rational basis for the highly reduced P/S.
See our latest analysis for Y-mAbs Therapeutics
How Has Y-mAbs Therapeutics Performed Recently?
With revenue growth that's superior to most other companies of late, Y-mAbs Therapeutics has been doing relatively well. It might be that many expect the strong revenue performance to degrade substantially, which has repressed the share price, and thus the P/S ratio. If you like the company, you'd be hoping this isn't the case so that you could potentially pick up some stock while it's out of favour.
If you'd like to see what analysts are forecasting going forward, you should check out our free report on Y-mAbs Therapeutics.
What Are Revenue Growth Metrics Telling Us About The Low P/S?
The only time you'd be truly comfortable seeing a P/S as depressed as Y-mAbs Therapeutics' is when the company's growth is on track to lag the industry decidedly.
Retrospectively, the last year delivered an exceptional 87% gain to the company's top line. Still, revenue has barely risen at all from three years ago in total, which is not ideal. So it appears to us that the company has had a mixed result in terms of growing revenue over that time.
Looking ahead now, revenue is anticipated to climb by 16% each year during the coming three years according to the eight analysts following the company. Meanwhile, the rest of the industry is forecast to expand by 92% per annum, which is noticeably more attractive.
In light of this, it's understandable that Y-mAbs Therapeutics' P/S sits below the majority of other companies. It seems most investors are expecting to see limited future growth and are only willing to pay a reduced amount for the stock.
What Does Y-mAbs Therapeutics' P/S Mean For Investors?
Even after such a strong price move, Y-mAbs Therapeutics' P/S still trails the rest of the industry. We'd say the price-to-sales ratio's power isn't primarily as a valuation instrument but rather to gauge current investor sentiment and future expectations.
As expected, our analysis of Y-mAbs Therapeutics' analyst forecasts confirms that the company's underwhelming revenue outlook is a major contributor to its low P/S. Shareholders' pessimism on the revenue prospects for the company seems to be the main contributor to the depressed P/S. Unless these conditions improve, they will continue to form a barrier for the share price around these levels.
And what about other risks? Every company has them, and we've spotted 2 warning signs for Y-mAbs Therapeutics (of which 1 shouldn't be ignored!) you should know about.
If companies with solid past earnings growth is up your alley, you may wish to see this free collection of other companies with strong earnings growth and low P/E ratios.
Have feedback on this article? Concerned about the content? Get in touch with us directly. Alternatively, email editorial-team (at) simplywallst.com.
This article by Simply Wall St is general in nature. We provide commentary based on historical data and analyst forecasts only using an unbiased methodology and our articles are not intended to be financial advice. It does not constitute a recommendation to buy or sell any stock, and does not take account of your objectives, or your financial situation. We aim to bring you long-term focused analysis driven by fundamental data. Note that our analysis may not factor in the latest price-sensitive company announcements or qualitative material. Simply Wall St has no position in any stocks mentioned.
Join A Paid User Research Session
You’ll receive a US$30 Amazon Gift card for 1 hour of your time while helping us build better investing tools for the individual investors like yourself. Sign up here
