YPF SA (YPF): A Closer Look at its Overvaluation
YPF SA (NYSE:YPF) stock has recently experienced a daily loss of 4.03%, with a 3-month loss of 3.43%. Despite an Earnings Per Share (EPS) of 4.4, the question remains: is the stock significantly overvalued? This article aims to provide a comprehensive valuation analysis of YPF SA (NYSE:YPF) to answer this question. Keep reading to learn more about the company's financial health, growth prospects, and intrinsic value.
Company Overview
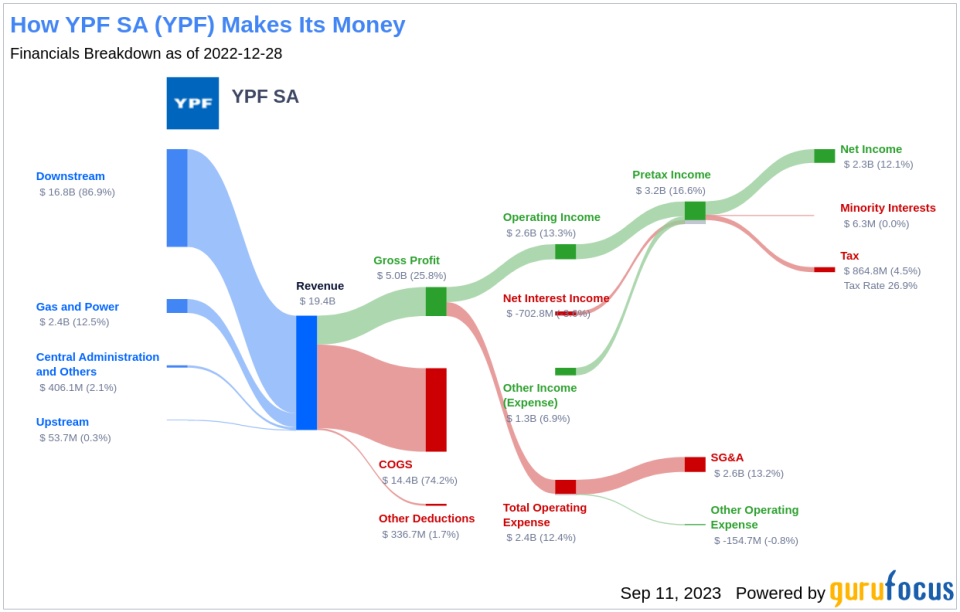
YPF SA is an Argentina-based integrated oil and gas company that operates across domestic upstream, downstream, and gas and power segments. The company's upstream operations consist of the exploration, development, and production of crude oil, natural gas, and LPG. Its downstream operations include refining, marketing, transportation, and distribution of oil, petroleum products, petroleum derivatives, petrochemicals, LPG, and bio-fuels. The majority of the company's revenue is generated from the downstream segment.
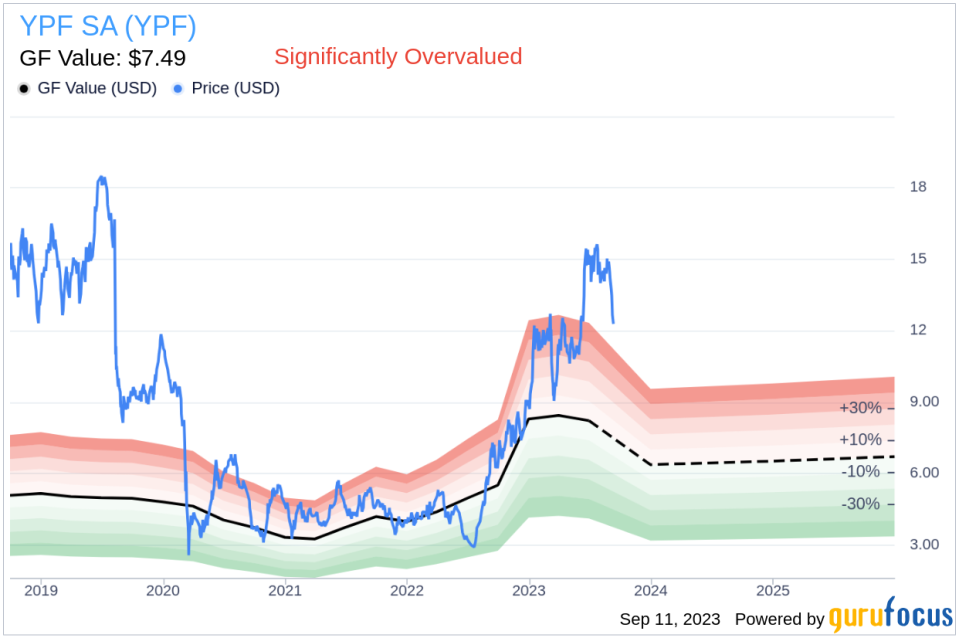
Currently, YPF SA (NYSE:YPF) is trading at $12.15 per share, with a market cap of $4.80 billion. This is significantly higher than its GF Value of $7.49, indicating that the stock might be overvalued.
Understanding GF Value
The GF Value is a proprietary measure that reflects the intrinsic value of a stock. It is calculated based on historical multiples, a GuruFocus adjustment factor, and future business performance estimates. The GF Value Line on the stock summary page provides an overview of the fair value at which the stock should ideally be traded.
YPF SA (NYSE:YPF)'s stock appears to be significantly overvalued according to the GF Value calculation. If a stock's price is significantly above the GF Value Line, it is considered overvalued and its future return is likely to be poor. Conversely, if it is significantly below the GF Value Line, its future return is likely to be higher.
Given that YPF SA is significantly overvalued, the long-term return of its stock is likely to be much lower than its future business growth.
Link: These companies may deliver higher future returns at reduced risk.
Financial Strength
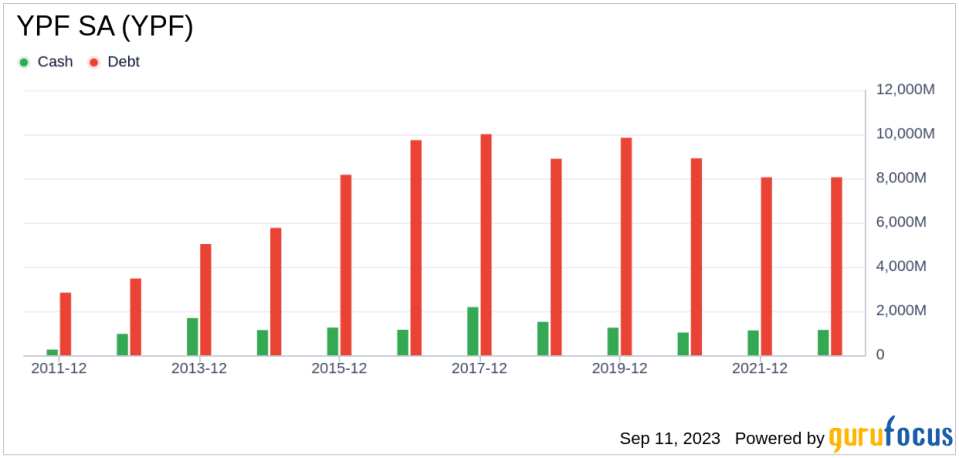
It is crucial to assess the financial strength of a company before buying its stock. Investing in companies with poor financial strength carries a higher risk of permanent loss. Evaluating the cash-to-debt ratio and interest coverage can provide a clear understanding of a company's financial strength. YPF SA has a cash-to-debt ratio of 0.18, which is worse than 70.48% of 1023 companies in the Oil & Gas industry. The overall financial strength of YPF SA is 5 out of 10, indicating that its financial strength is fair.
Profitability and Growth
Investing in profitable companies carries less risk, especially if the company has demonstrated consistent profitability over the long term. A company with high profit margins typically offers better performance potential than a company with low profit margins. YPF SA has been profitable 7 years over the past 10 years. During the past 12 months, the company had revenues of $23.20 billion and Earnings Per Share (EPS) of $4.4. Its operating margin of 9.07% is better than 50.72% of 970 companies in the Oil & Gas industry. Overall, GuruFocus ranks YPF SA's profitability as fair.
Growth is one of the most important factors in the valuation of a company. Long-term stock performance is closely correlated with growth. Companies that grow faster create more value for shareholders, especially if that growth is profitable. The average annual revenue growth of YPF SA is 69.6%, which ranks better than 95.43% of 853 companies in the Oil & Gas industry. The 3-year average EBITDA growth is 79.3%, which ranks better than 93.06% of 821 companies in the Oil & Gas industry.
ROIC vs WACC
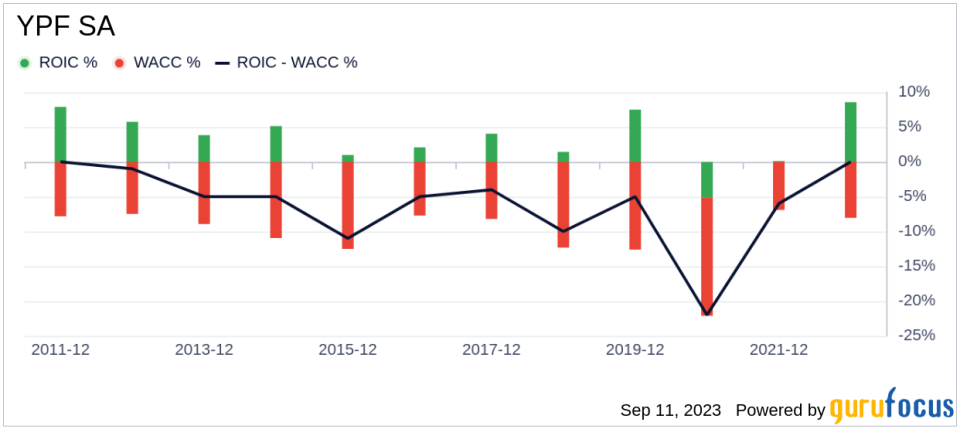
Profitability can also be evaluated by comparing a company's return on invested capital (ROIC) to its weighted average cost of capital (WACC). ROIC measures how well a company generates cash flow relative to the capital it has invested in its business. WACC is the rate that a company is expected to pay on average to all its security holders to finance its assets. If the ROIC exceeds the WACC, the company is likely creating value for its shareholders. During the past 12 months, YPF SA's ROIC was 6.83 while its WACC came in at 9.36.
Conclusion
In conclusion, the stock of YPF SA (NYSE:YPF) appears to be significantly overvalued. The company's financial condition is fair, and its profitability is fair. Its growth ranks better than 93.06% of 821 companies in the Oil & Gas industry. To learn more about YPF SA stock, you can check out its 30-Year Financials here.
To find out the high-quality companies that may deliver above-average returns, please check out GuruFocus High Quality Low Capex Screener.
This article first appeared on GuruFocus.
