YPF SA (YPF): A Comprehensive Analysis of Its Overvalued Market Position
YPF SA (NYSE:YPF) experienced a daily gain of 2.58%, despite a 3-month loss of -14.92%. With an Earnings Per Share (EPS) of 4.4, the question arises: is the stock significantly overvalued? This article will delve into a comprehensive valuation analysis of YPF SA (NYSE:YPF), providing valuable insights for potential investors.
Company Introduction
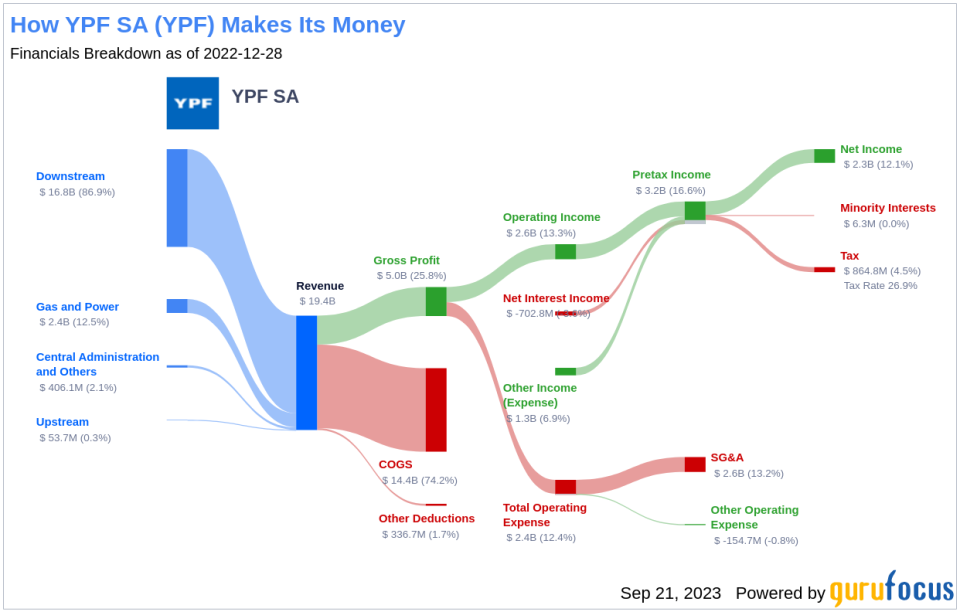
YPF SA is an Argentina-based integrated oil and gas company, operating a fully integrated oil and gas chain across domestic upstream, downstream, and gas and power segments. The company's upstream operations involve the exploration, development, and production of crude oil, natural gas, and LPG. Its downstream operations include refining, marketing, transportation, and distribution of various petroleum products, derivatives, petrochemicals, LPG, and bio-fuels. The company generates maximum revenue from its downstream segment.
Understanding GF Value
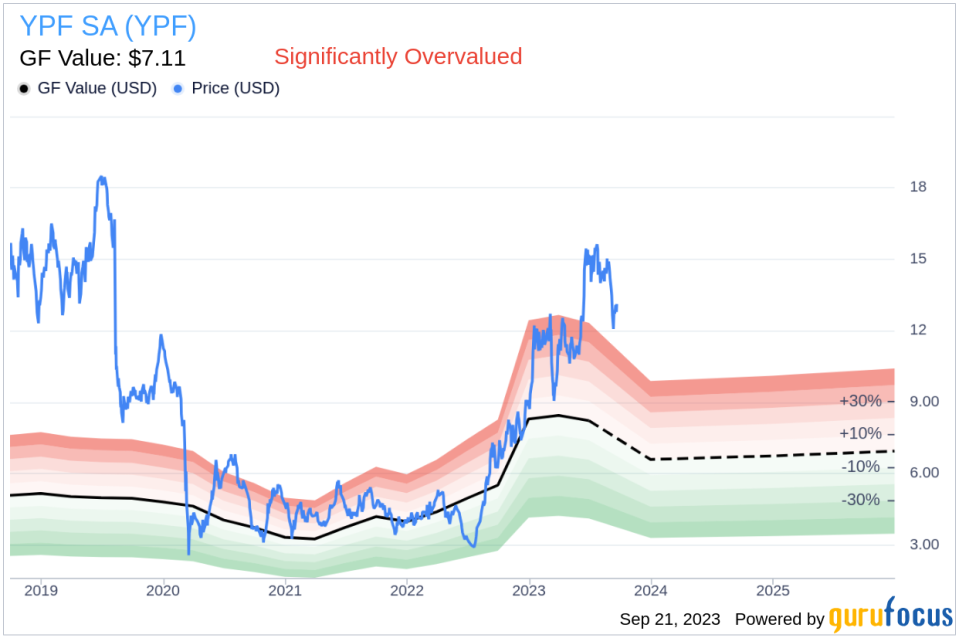
The GF Value is a proprietary measure that represents the current intrinsic value of a stock. The GF Value Line provides an overview of the fair value at which the stock should ideally trade. It is calculated based on historical multiples, a GuruFocus adjustment factor based on the company's past returns and growth, and future estimates of business performance.
YPF SA's stock appears to be significantly overvalued based on the GF Value. The stock's fair value is estimated based on historical multiples, an internal adjustment based on the company's past business growth, and analyst estimates of future business performance. If the share price significantly exceeds the GF Value Line, the stock is likely overvalued, and its future returns may be poor. Conversely, if the share price is significantly below the GF Value Line, the stock may be undervalued and could potentially offer higher future returns. With its current price of $13.12 per share, YPF SA's stock appears to be significantly overvalued.
Since YPF SA is significantly overvalued, the long-term return of its stock is likely to be much lower than its future business growth. Link: These companies may deliver higher future returns at reduced risk.
Financial Strength
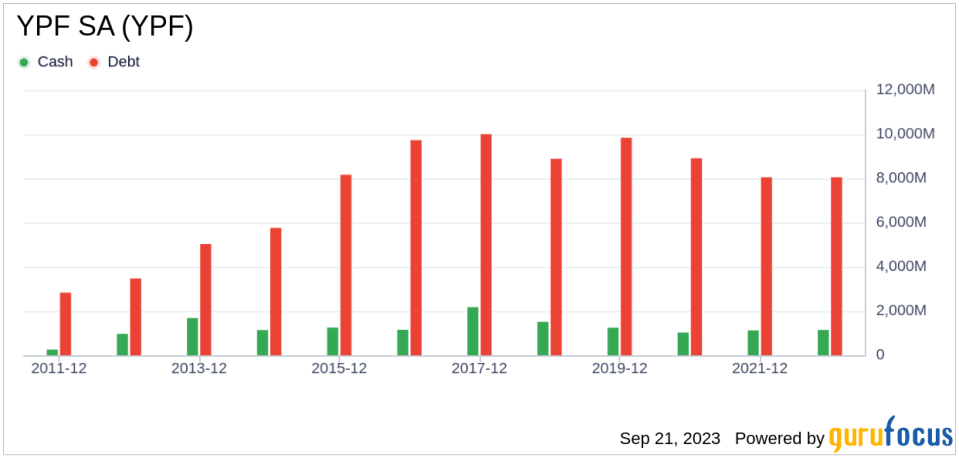
Before investing in a company, it's crucial to assess its financial strength. Companies with poor financial strength pose a higher risk of permanent loss. The cash-to-debt ratio and interest coverage can provide valuable insights into a company's financial strength. YPF SA has a cash-to-debt ratio of 0.18, which is worse than 70.86% of 1033 companies in the Oil & Gas industry. The overall financial strength of YPF SA is 5 out of 10, indicating fair financial strength.
Profitability and Growth
Investing in profitable companies, especially those with consistent long-term profitability, is often less risky. High-profit margin companies are generally safer investments than those with low profit margins. YPF SA has been profitable for seven of the past ten years. Over the past twelve months, the company generated a revenue of $23.20 billion and Earnings Per Share (EPS) of $4.4. Its operating margin is 9.07%, ranking better than 50.71% of 984 companies in the Oil & Gas industry. Overall, YPF SA's profitability is ranked 7 out of 10, indicating fair profitability.
Growth is a crucial factor in a company's valuation. GuruFocus research has found that growth is closely correlated with the long-term performance of a company's stock. The faster a company is growing, the more likely it is to be creating value for shareholders, especially if the growth is profitable. The 3-year average annual revenue growth rate of YPF SA is 69.6%, ranking better than 95.47% of 861 companies in the Oil & Gas industry. The 3-year average EBITDA growth rate is 79.3%, ranking better than 93.01% of 830 companies in the Oil & Gas industry.
ROIC vs WACC
Another method of determining a company's profitability is to compare its return on invested capital to the weighted average cost of capital. Return on invested capital (ROIC) measures how well a company generates cash flow relative to the capital it has invested in its business. The weighted average cost of capital (WACC) is the rate that a company is expected to pay on average to all its security holders to finance its assets. When the ROIC is higher than the WACC, it implies the company is creating value for shareholders. For the past 12 months, YPF SA's return on invested capital is 6.83, and its cost of capital is 9.55.

Conclusion
In conclusion, the stock of YPF SA (NYSE:YPF) shows every sign of being significantly overvalued. The company's financial condition and profitability are fair, and its growth ranks better than 93.01% of 830 companies in the Oil & Gas industry. To learn more about YPF SA stock, you can check out its 30-Year Financials here.
To find out the high-quality companies that may deliver above-average returns, please check out GuruFocus High Quality Low Capex Screener.
This article first appeared on GuruFocus.
