YPF SA (YPF): An Extensive Analysis of its Overvaluation
YPF SA (NYSE:YPF), an integrated oil and gas company based in Argentina, has been experiencing some significant market fluctuations. With a daily loss of -9.76% and a 3-month loss of -27.55%, the company's Earnings Per Share (EPS) stands at 4.4. But is the stock significantly overvalued? This in-depth analysis aims to answer this question and provide a clearer picture of the company's valuation status. Read on to explore the financials, growth, and profitability of YPF SA (NYSE:YPF).
A Glimpse of YPF SA
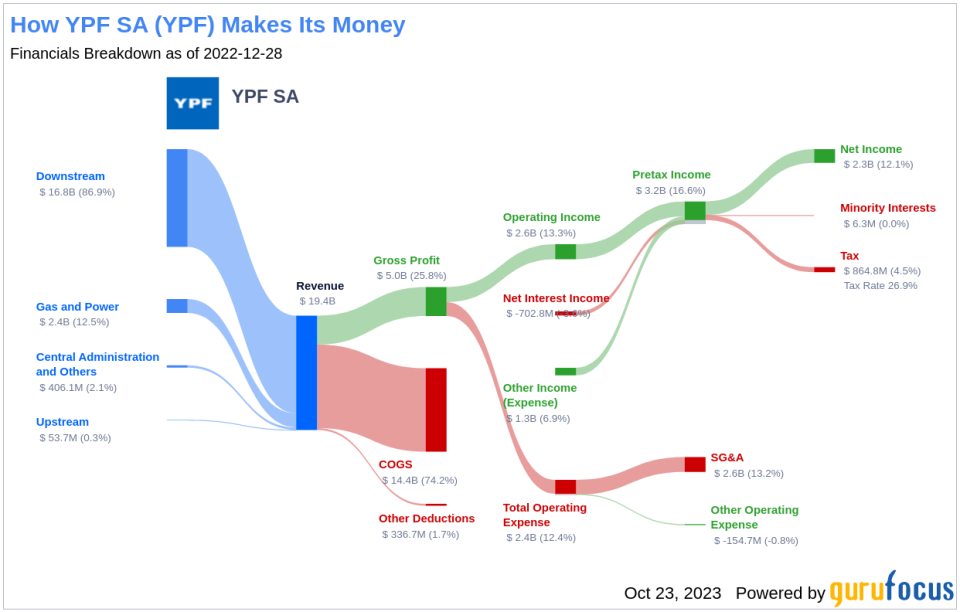
YPF SA is a fully integrated oil and gas company operating across the domestic upstream, downstream, and gas and power segments in Argentina. The company's upstream operations consist of the exploration, development, and production of crude oil, natural gas, and LPG. Its downstream operations include the refining, marketing, transportation, and distribution of oil and a wide range of petroleum products, petroleum derivatives, petrochemicals, LPG, and bio-fuels. Despite its comprehensive operations, the question remains: is the stock price aligned with the GF Value, the estimated fair value? Let's dive into the company's value analysis.
Understanding the GF Value
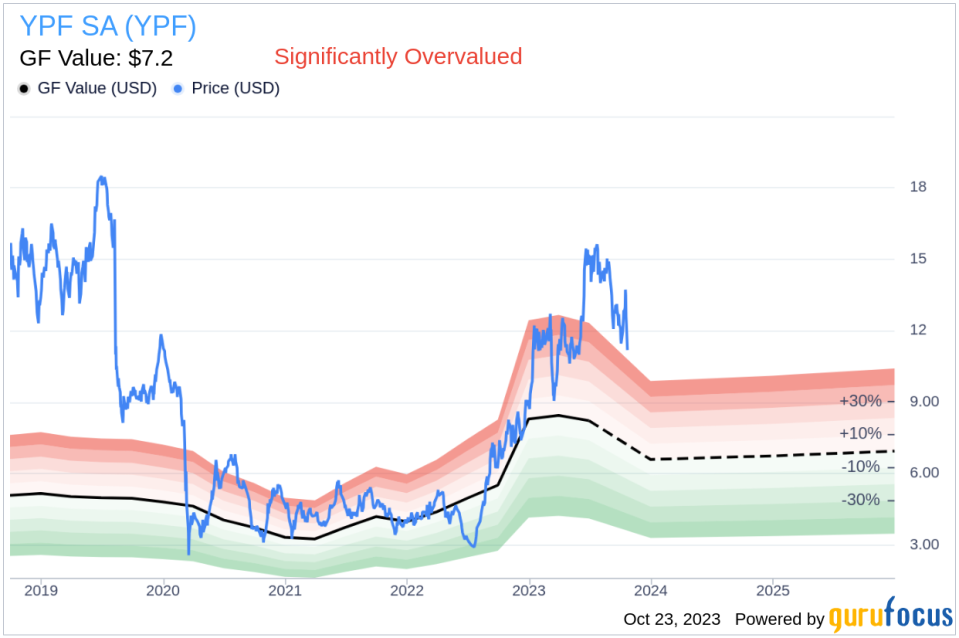
The GF Value is a unique measure of a stock's intrinsic value. It is computed based on historical trading multiples, a GuruFocus adjustment factor derived from the company's past performance and growth, and future business performance estimates. The GF Value Line gives an overview of the fair value at which the stock should ideally be traded. If the stock price is significantly above the GF Value Line, it is overvalued, and its future return is likely to be poor. Conversely, if it is significantly below the GF Value Line, its future return will likely be higher.
Currently, YPF SA (NYSE:YPF) stock is estimated to be significantly overvalued. The stock is trading at $11.09 per share, with a market cap of $4.40 billion. Given its overvaluation, the long-term return of its stock is likely to be much lower than its future business growth.
Financial Strength of YPF SA
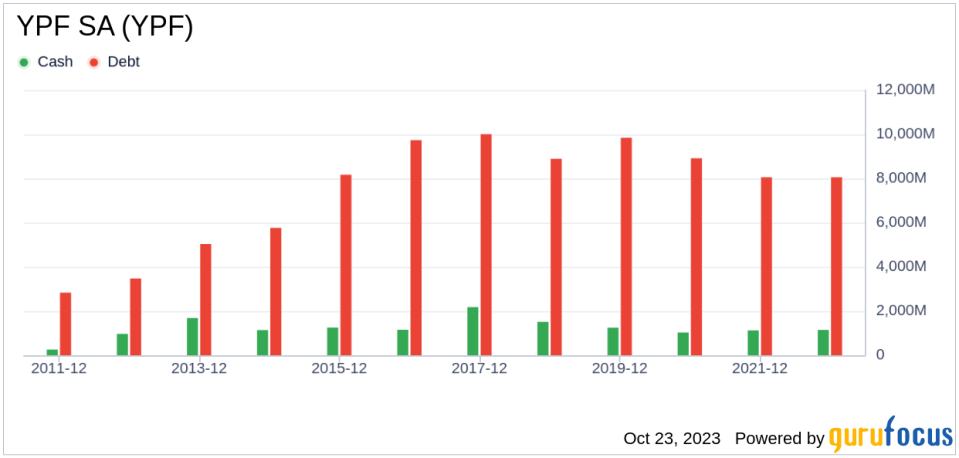
Investing in companies with low financial strength can result in permanent capital loss. Therefore, a careful review of a company's financial strength is crucial before deciding to buy shares. YPF SA has a cash-to-debt ratio of 0.18, ranking worse than 70.82% of 1035 companies in the Oil & Gas industry. Based on this, GuruFocus ranks YPF SA's financial strength as 5 out of 10, suggesting a fair balance sheet.
Profitability and Growth of YPF SA
Consistently profitable companies offer less risk for investors. Higher profit margins usually indicate a better investment compared to a company with lower profit margins. YPF SA has been profitable 7 over the past 10 years. Over the past twelve months, the company had a revenue of $23.20 billion and Earnings Per Share (EPS) of $4.4. Its operating margin is 9.07%, ranking better than 51.32% of 988 companies in the Oil & Gas industry. Overall, the profitability of YPF SA is ranked 7 out of 10, indicating fair profitability.
Growth is a crucial factor in the valuation of a company. The 3-year average annual revenue growth rate of YPF SA is 69.6%, ranking better than 95.59% of 862 companies in the Oil & Gas industry. The 3-year average EBITDA growth rate is 79.3%, ranking better than 92.86% of 826 companies in the Oil & Gas industry.
ROIC vs WACC: A Comparison
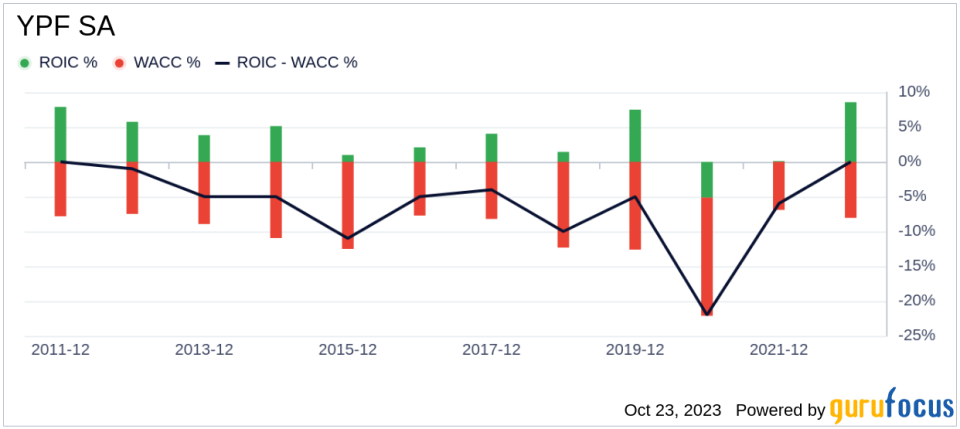
Return on invested capital (ROIC) measures how well a company generates cash flow relative to the capital it has invested in its business. The weighted average cost of capital (WACC) is the rate that a company is expected to pay on average to all its security holders to finance its assets. For the past 12 months, YPF SA's return on invested capital is 6.83, and its cost of capital is 10.11.
Conclusion
In summary, the stock of YPF SA (NYSE:YPF) is estimated to be significantly overvalued. The company's financial condition is fair, and its profitability is fair. Its growth ranks better than 92.86% of 826 companies in the Oil & Gas industry. To learn more about YPF SA stock, you can check out its 30-Year Financials here.
To find out the high-quality companies that may deliver above-average returns, please check out GuruFocus High Quality Low Capex Screener.
This article, generated by GuruFocus, is designed to provide general insights and is not tailored financial advice. Our commentary is rooted in historical data and analyst projections, utilizing an impartial methodology, and is not intended to serve as specific investment guidance. It does not formulate a recommendation to purchase or divest any stock and does not consider individual investment objectives or financial circumstances. Our objective is to deliver long-term, fundamental data-driven analysis. Be aware that our analysis might not incorporate the most recent, price-sensitive company announcements or qualitative information. GuruFocus holds no position in the stocks mentioned herein.
This article first appeared on GuruFocus.
