Take the Zacks Approach to Beat the Market: Novo Nordisk, Amgen, Fabrinet in Focus
All of the three widely followed indexes closed out last week with losses. The Dow Jones Industrial Average, S&P 500 and tech-heavy Nasdaq Composite slid 1.6%, 2.4% and 3.2%, respectively. The S&P 500 snapped two straight weeks of gains.
The stock market continues to be turbulent, with investors reeling under the apprehension that there would be further interest hikes from the Fed in their bid to control inflation. Robust numbers from the retail market have added to this sentiment. However, the biggest drag in the market last week was the benchmark 10-year treasury note yield, which briefly crossed the 5% mark for the first time in more than 16 years. Disappointing earnings reports presented by mid-sized banks have also raised questions about whether the government’s aid to the sector has had any effect.
The conflict raging in the Gaza strip keeps investors on tenterhooks while sharply lowering consumer sentiments. Market participants would keep a vigilant eye on further signals coming in from the Fed to gauge whether a soft landing of the economy is possible at all.
Regardless of market conditions, we, here at Zacks, provide investors with unbiased guidance on how to beat the market.
As usual, Zacks Research guided investors over the past three months with its time-tested methodologies. Given the prevailing market uncertainty, you may want to look at our feats to prepare better for your next action.
Here are some of our key achievements:
Clearwater Analytics and Molina Healthcare Surge Following Zacks Rank Upgrade
Shares of Clearwater Analytics Holdings, Inc. CWAN have gained 12.3% (versus the S&P 500’s 6.1% decrease) since it was upgraded to a Zacks Rank #2 (Buy) on August 8.
Another stock, Molina Healthcare, Inc. MOH, which was also upgraded to a Zacks Rank #2 on August 10, has returned 11.1% (versus the S&P 500’s 5.1% decrease) since then.
Zacks Rank, our short-term rating system, has earnings estimate revisions at its core. Empirical research shows a strong correlation between trends in earnings estimate revisions and near-term stock price movements.
A hypothetical portfolio of Zacks Rank #1 (Strong Buy) stocks returned +12.02% this year (through September 4th) vs. +18.2% for the S&P 500 index and +7.6% for the equal-weight S&P 500 index. The portfolio of Zacks Rank #1 stocks is an equal-weight portfolio, while the S&P 500 index is a market-cap-weighted index that has been notably distorted by the strong recent performance of mega-cap stocks.
We are not trying to cherry-pick here. But since this Zacks Model portfolio, consisting of Zacks Rank #1 stocks, is an equal-weight portfolio, the equal-weight S&P 500 index is the appropriate benchmark for comparison. Looked at this way, this portfolio has outperformed the index this year.
The Zacks Model Portfolio - consisting of Zacks Rank #1 stocks – has outperformed the S&P index by more than 13 percentage points since 1988 (Through September 4th, 2023, the Zacks # 1 Rank stocks has generated an annualized return of +24.17% since 1988 vs. +10.82% for the S&P 500 index).You can see the complete list of today’s Zacks Rank #1 stocks here >>>
Check Clearwater’s historical EPS and Sales here>>>
Check Molina’s historical EPS and Sales here>>>
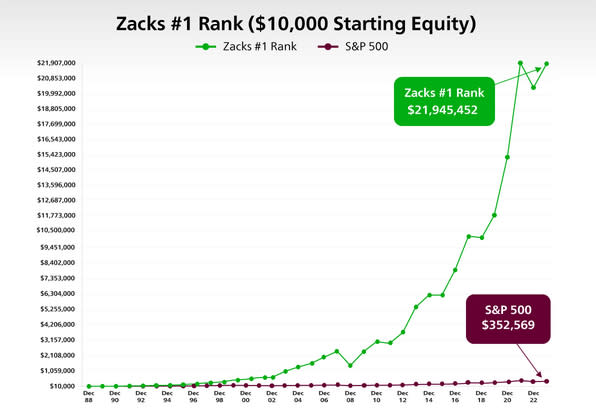
Image Source: Zacks Investment Research
Zacks Recommendation Upgrades MakeMyTrip and Kimbell Royalty Higher
Shares of MakeMyTrip Limited MMYT and Kimbell Royalty Partners, LP KRP have advanced 11.6% (versus the S&P 500’s 5.7% fall) and 9.6% (versus the S&P 500’s 5.1% fall) since their Zacks Recommendation was upgraded to Outperform on August 4 and August 10, respectively.
While the Zacks Rank is our short-term rating system that is most effective over the one- to three-month holding horizon, the Zacks Recommendation aims to predict performance over the next 6 to 12 months. However, just like the Zacks Rank, the foundation for the Zacks Recommendation is trends in earnings estimate revisions.
The Zacks Recommendation classifies stocks into three groups — Outperform, Neutral and Underperform. While these recommendations are determined quantitatively, our analysts have the flexibility to override them for the 1100+ stocks they closely follow based on their better judgment of factors such as valuation, industry conditions and management effectiveness than the quantitative model.
To access our research reports with Zacks Recommendations for the 1100+ stocks we cover, click here>>>
Zacks Focus List Stocks ICF, Lululemon Shoot Up
Shares of ICF International, Inc. ICFI, which belongs to the Zacks Focus List, have gained 8.4% over the past 12 weeks. The stock was added to the Focus List on April 23, 2018. Another Focus-List holding, Lululemon Athletica Inc. LULU, which was added to the portfolio on December 12, 2017, has returned 6.8% over the past 12 weeks. The S&P 500 has declined 7.4% over this period.
The 50-stock Zacks Focus List model portfolio returned +22.3% in 2023 (through July 31st) vs. +20.6% for the S&P 500 index and +10.5% for the equal-weight S&P 500 index. In 2022, the portfolio produced -15.2% vs. the S&P 500 index’s -17.96%.
Since 2004, the Focus List portfolio has produced an annualized return of +11.27% through July 31st, 2023. This compares to a +9.65% annualized return for the S&P 500 index in the same time period.
On a rolling one-, three- and five-year bases, the Zacks Focus List returned +21.76%, +16.33%, and +12.54% vs. +12.99%, +13.71% and +12.19% for the S&P 500 index, respectively.
Unlock all of our powerful research, tools and analysis, including the Focus List, Zacks #1 Rank List, Equity Research Reports, Zacks Earnings ESP Filter, Premium Screener and more, as part of Zacks Premium. Gain full access now >>
Zacks ECAP Stocks Novo Nordisk and Fair Isaac Make Significant Gains
Novo Nordisk A/S NVO, a component of our Earnings Certain Admiral Portfolio (ECAP), has jumped 22.9% over the past 12 weeks. Fair Isaac Corporation FICO has followed Novo Nordisk with 11.2% returns.
ECAP, which consists of 30 concentrated, ultra-defensive, long-term Buy and Hold stocks, has returned +6.67% in 2023 (through June 30) versus +16.90% for the S&P 500 Index. The portfolio returned -4.7% in 2022 versus the S&P 500 Index’s -17.96%.
With little to no turnover and annual rebalance periodicity, the ECAP seeks to minimize capital loss by holding shares of companies whose earnings streams exhibit a proven 20+ year track record of surviving recessionary periods with minimal impact on aggregate earnings growth relative to the overall S&P 500.
The ECAP and many other model portfolios are available as part of Zacks Advisor Tools, a cloud-based solution to access Zacks award-winning stock, mutual fund and ETF research. Click here to schedule a demo.
Zacks ECDP Stocks Amgen and UnitedHealth Outperform Peers
Amgen Inc. AMGN, which is part of our Earnings Certain Dividend Portfolio (ECDP), has returned 18.1% over the past 12 weeks. Another ECDP stock, UnitedHealth Group Incorporated UNH, has climbed 4.3% over the same time frame. Of course, the inclination of investors toward quality dividend stocks to secure an income stream amid heightened market volatility contributed to this performance.
Check Amgen’s dividend history here>>>
Check UnitedHealth’s dividend history here>>>
With an extremely low Beta and a history of minimum earnings variability over the last 20+ years, this 25-stock portfolio helps significantly mitigate risk.
ECDP has returned +0.18% in 2023 (through June 30) versus +16.90% for the S&P 500 Index. The portfolio returned -2.3% in 2022 versus -17.96% for the S&P 500 Index and -8.34% for the ProShares S&P 500 Dividend Aristocrats ETF NOBL.
Click here to access this portfolio on Zacks Advisor Tools.
Zacks Top 10 Stocks — Fabrinet Delivers Solid Returns
Fabrinet FN, from the Zacks Top 10 Stocks for 2023, has gained 25.4% year to date, which compares to an 11.4% gain for the S&P 500 Index.
The portfolio returned +16.16% through the end of July 2023 vs. +20.64% for the S&P 500 index and +10.73% for the equal-weighted version of the index. The portfolio returned -15.8% in 2022 vs. -18.1% for the S&P 500 index. Since 2012, the Top 10 portfolio has generated an annualized return of +22.78% vs. +13.65% for the S&P 500 index.
Since the start of 2012 through July 31, 2023, the Zacks Top 10 Stocks has produced a cumulative return of +977.47% vs. +340.35% cumulative return for the S&P 500 index.
Want the latest recommendations from Zacks Investment Research? Today, you can download 7 Best Stocks for the Next 30 Days. Click to get this free report
UnitedHealth Group Incorporated (UNH) : Free Stock Analysis Report
Novo Nordisk A/S (NVO) : Free Stock Analysis Report
Amgen Inc. (AMGN) : Free Stock Analysis Report
Molina Healthcare, Inc (MOH) : Free Stock Analysis Report
lululemon athletica inc. (LULU) : Free Stock Analysis Report
MakeMyTrip Limited (MMYT) : Free Stock Analysis Report
Fair Isaac Corporation (FICO) : Free Stock Analysis Report
Fabrinet (FN) : Free Stock Analysis Report
ICF International, Inc. (ICFI) : Free Stock Analysis Report
ProShares S&P 500 Dividend Aristocrats ETF (NOBL): ETF Research Reports
Kimbell Royalty (KRP) : Free Stock Analysis Report
Clearwater Analytics Holdings, Inc. (CWAN) : Free Stock Analysis Report
