Zalando SE's (ETR:ZAL) Fundamentals Look Pretty Strong: Could The Market Be Wrong About The Stock?
Zalando (ETR:ZAL) has had a rough three months with its share price down 18%. However, stock prices are usually driven by a company’s financials over the long term, which in this case look pretty respectable. Specifically, we decided to study Zalando's ROE in this article.
Return on equity or ROE is a key measure used to assess how efficiently a company's management is utilizing the company's capital. In other words, it is a profitability ratio which measures the rate of return on the capital provided by the company's shareholders.
See our latest analysis for Zalando
How To Calculate Return On Equity?
The formula for return on equity is:
Return on Equity = Net Profit (from continuing operations) ÷ Shareholders' Equity
So, based on the above formula, the ROE for Zalando is:
4.8% = €110m ÷ €2.3b (Based on the trailing twelve months to September 2023).
The 'return' refers to a company's earnings over the last year. So, this means that for every €1 of its shareholder's investments, the company generates a profit of €0.05.
What Has ROE Got To Do With Earnings Growth?
Thus far, we have learned that ROE measures how efficiently a company is generating its profits. We now need to evaluate how much profit the company reinvests or "retains" for future growth which then gives us an idea about the growth potential of the company. Generally speaking, other things being equal, firms with a high return on equity and profit retention, have a higher growth rate than firms that don’t share these attributes.
Zalando's Earnings Growth And 4.8% ROE
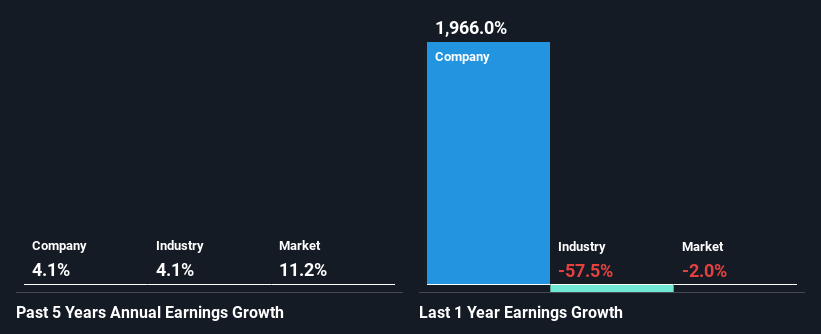
On the face of it, Zalando's ROE is not much to talk about. However, given that the company's ROE is similar to the average industry ROE of 4.6%, we may spare it some thought. We can see that Zalando has grown at a five year net income growth average rate of 4.1%, which is a bit on the lower side. Bear in mind, the company's ROE is not very high . Hence, this does provide some context to low earnings growth seen by the company.
We then performed a comparison between Zalando's net income growth with the industry, which revealed that the company's growth is similar to the average industry growth of 4.1% in the same 5-year period.
The basis for attaching value to a company is, to a great extent, tied to its earnings growth. What investors need to determine next is if the expected earnings growth, or the lack of it, is already built into the share price. This then helps them determine if the stock is placed for a bright or bleak future. If you're wondering about Zalando's's valuation, check out this gauge of its price-to-earnings ratio, as compared to its industry.
Is Zalando Efficiently Re-investing Its Profits?
Zalando doesn't pay any dividend, which means that it is retaining all of its earnings. However, this doesn't explain the low earnings growth the company has seen. So there could be some other explanation in that regard. For instance, the company's business may be deteriorating.
Summary
Overall, we feel that Zalando certainly does have some positive factors to consider. Specifically, its fairly high earnings growth number, which no doubt was backed by the company's high earnings retention. Still, the low ROE means that all that reinvestment is not reaping a lot of benefit to the investors. Having said that, looking at the current analyst estimates, we found that the company's earnings are expected to gain momentum. Are these analysts expectations based on the broad expectations for the industry, or on the company's fundamentals? Click here to be taken to our analyst's forecasts page for the company.
Have feedback on this article? Concerned about the content? Get in touch with us directly. Alternatively, email editorial-team (at) simplywallst.com.
This article by Simply Wall St is general in nature. We provide commentary based on historical data and analyst forecasts only using an unbiased methodology and our articles are not intended to be financial advice. It does not constitute a recommendation to buy or sell any stock, and does not take account of your objectives, or your financial situation. We aim to bring you long-term focused analysis driven by fundamental data. Note that our analysis may not factor in the latest price-sensitive company announcements or qualitative material. Simply Wall St has no position in any stocks mentioned.
