The Zen of Price
Growth and value are two fundamental approaches, or styles, in stock investing. Growth investors seek companies that offer strong earnings growth, while value investors seek stocks that appear to be undervalued and which they expect will return to fair value over time. Because the two styles complement each other, they can help add diversity to a portfolio when used together. When used together, some call the amalgamation "growth at a reasonable price," or GARP. Warren Buffett (Trades, Portfolio) has said the difference between value and growth investing is a false dichotomy. He wrote in Berkshire Hathaway's (NYSE:BRK.A) (NYSE:BRK.B) 1993 annual letter:
"Most analysts feel they must choose between two approaches customarily thought to be in opposition: 'value' and 'growth.' Indeed, many investment professionals see any mixing of the two terms as a form of intellectual cross-dressing. We view that as fuzzy thinking (in which, it must be confessed, I myself engaged some years ago). In our opinion, the two approaches are joined at the hip: Growth is always a component in the calculation of value, constituting a variable whose importance can range from negligible to enormous and whose impact can be negative as well as positive.
Buffet's business partner, the late Charlie Munger, further summed this up when he said,"Basically, all investment is value investment in the sense that you're always trying to get better prospects that you're paying for."
Thus, a primary goal for investors is to not to overpay for stocks, whether you are going for growth or going for value (or conversely, not to sell too cheaply if you are selling). This is a particularly acute problem for growth investors as they have a tendency to overpay for growth. On the other hand, the major problem for value investors is a tendency to buy value traps, which they think are cheap, but actually expensive because they do not account for a declining business. For every security, there is a "stupid price zone" and a "smart price zone" and a range of values in between. The idea is to buy at the "smart" zone and sell at the "stupid" zone. Another trap for investors is timing, meaning either buying or selling too early or too late. This is easier said than done, of course. That is why Munger calls investing simple, but not easy.
Let us start this meditation on price with granddaddy of valuation techniques, the venerable price-earnings ratio.
Price-earnings ratio
The price-earnings ratio is, of course, a simplistic measure as it merely the ratio of stock price to earnings per share. It itself gives no guidance as to what is an acceptable ratio. Many investors have developed rules of thumb to judge whether a price-earnings ratio is expensive or cheap. For example, they would use a multiple of 15, which they consider the long-term price-eanings ratio of the S&P 500 as the bright line separating cheap from expensive. The lower the ratio, the cheaper the stock is. The higher the ratio, the more expensive it is.
The practical problem is that often the price-earnings ratio is wrong. For cyclical stocks, often the best time to buy is when the ratio is very high or is zero (because earnings have evaporated). Look at the chart of price and price-earnings ratio for Goodyear (NASDAQ:GT) (a classic cyclical stock) below.
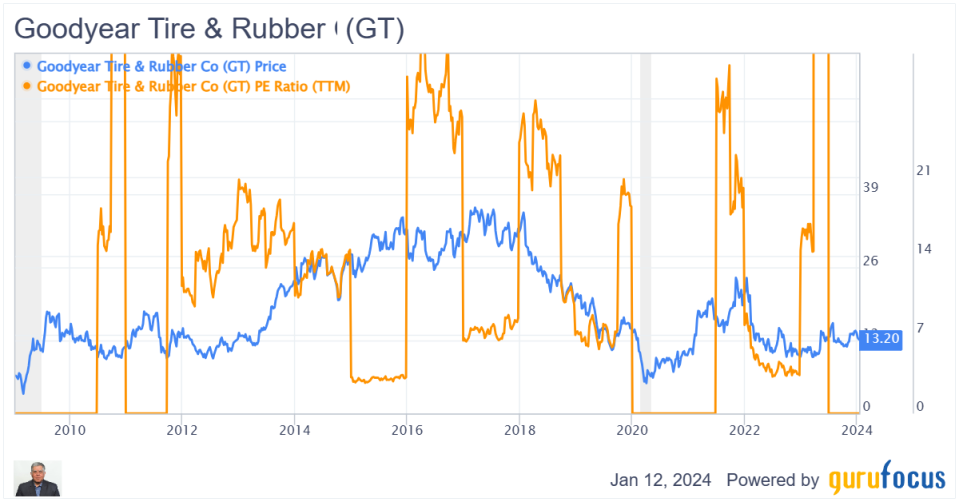
GT Data by GuruFocus
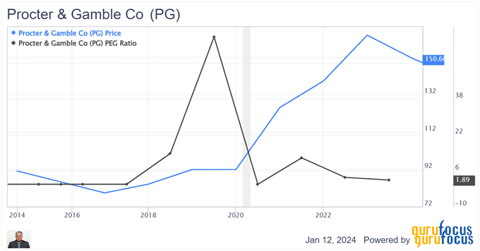
Another big problem with the ratio is the earnings are based on GAAP earnings, which can fluctuate widely and may not reflect the true state of affairs of the earning power of the company. Take a look at Procter & Gamble (NYSE:PG) below. A great time to buy the stock would have been is 2019 when the price-earnings ratio was actually very high (the company had taken some non-cash write-offs at that time, which crashed the stock temporarily). Expected and unexpected events are contantly rocking the price-earnings line, making it a very unreliable measure.
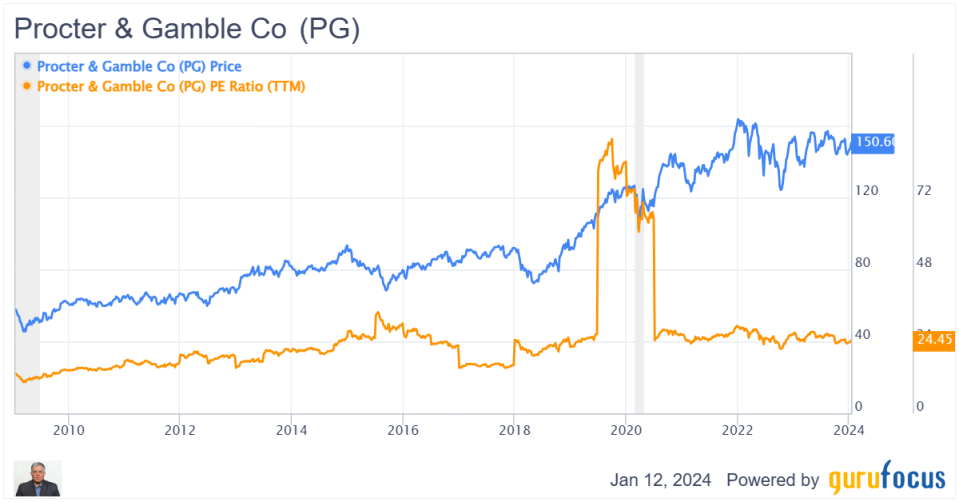
PG Data by GuruFocus
Median PE and Shiller PE
Some problems can be avoided by looking at the median price-earnings ratio over a period of time (say 10 years) and then deriving a "fair price" from this median. This technique would have got us into P&G in 2018-19, but we would have sold too soon in 2000 as the stock rebounded above the median price line.
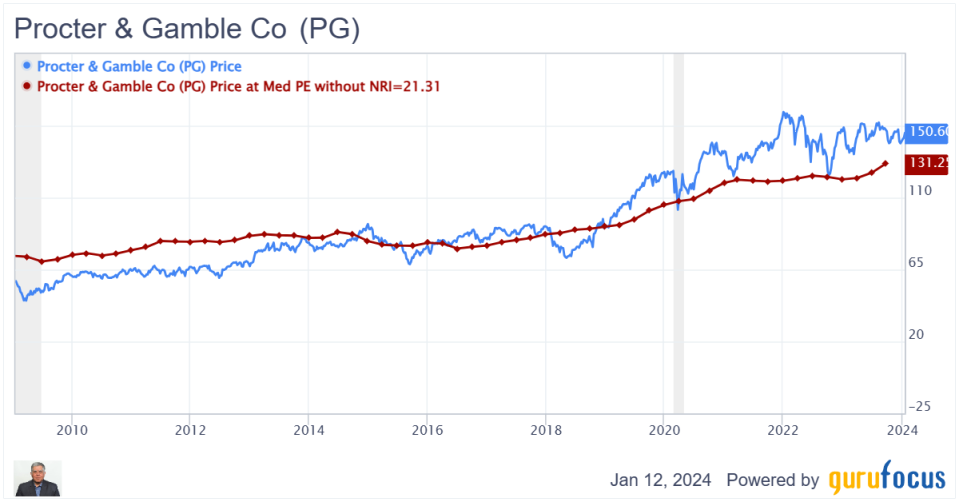
PG Data by GuruFocus
GuruFocus also provides the Shiller PE on its stock summary page, which is derived from the 10-year average of the inflation-adjusted earnings. Think of Shiller PE as a normalized price-earnings ratio that removes year-to-year distortions from the price-earnings line. In the chart below, the Shiller PE and price-earnings ratios are charted together with price. When the PE line is below the Shiller PE line, then chances are the stock may be undervalued (and vice versa).
However, this signal is not very clear in the case of Goodyear as the company is very cyclical. Both the regular and Shiller PEs fluctuate widely. We could argue that it is a good time to go long when the regular price-earnings ratio hits an extreme level or goes to zero and then sell when it comes back to normal.

GT Data by GuruFocus
For Goodyear, the median price-earnings technique does not work as the line is too fickle. Further, the median price-sales line, while better, is too slow to have much predictive value.
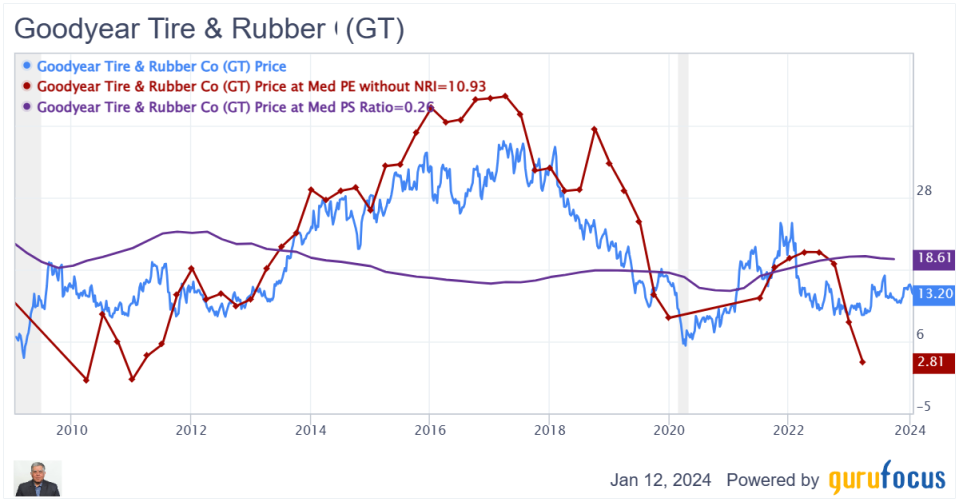
GT Data by GuruFocus
The main point I want to make is that while price-earnngs may be a quick and useful metric with most stocks, it has to be used carefully. Many times it is absolutely misleading. Charting the ratio with its derivatives is helpful to discern if there is a valid valuation signal. Overall, I feel the price-earnings ratio is more often misleading and do not rely on it much.
PEG ratio
Then there is the PEG ratio, an old warhorse that incorporates growth. It was popularized by famous former fund manager Peter Lynch, who argued that a PEG ratio of 1 was a fair price, as he thought the earnings growth of a stock should ideally equal or exceed its price-earnings ratio.
The price-earnings to growth ratio, or PEG ratio, is a valuation measure that investors use to get a broad assessment of a company's performance and evaluate investment risk.
PEG ratio is calculated as follows: PEG = PE ratio/Earnings growth over five years.
In theory, a PEG ratio of 1 represents a perfect correlation between the company's market value and its projected earnings growth. PEG ratios higher than 1 are generally considered unfavorable, suggesting a stock is overvalued. Conversely, ratios lower than 1 are considered better, indicating a stock is undervalued.
There are two problems with the PEG ratio, however. One is price-earnings (the numerator) itself is problematic, which I have gone over already. The second problem is the denominator, or growth. Lynch used projected earnings growth, which requires judgement and is frequently wrong. Thus, the PEG is reduced to a judgement call.
A popular, "more objective" number is to use past actual Ebitda growth. The problem, of course, is that this is backward-looking and assumes the past growth trajectory will continue in the future. I still lean toward the latter as there is no getting away from it, unless you want to get into the judgement game and plug in an estimated forward growth. For cyclical stocks like Goodyear, I would prefer to substitute one-year trailing 12-month Ebitda growth for the five-year growth as used for stocks like P&G.
The PEG ratio is more often wrong than right. Below is an annual chart showing price and PEG. As you can see, it is pretty much useless as a predictor of value or growth. (Note: chart below is annual numbers.)
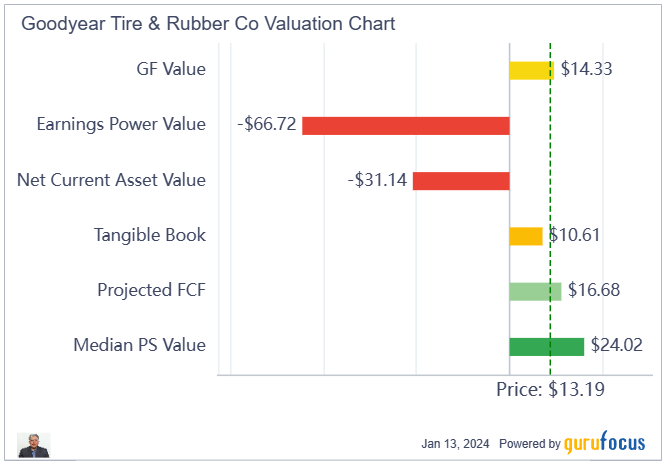
GF Value
The GF Value chart is a proprietary measure which compares a company's current stock price to its GF Value Line. The GF Value Line is an intrinsic value estimate developed by GuruFocus that is calculated based on the following factors:
Historical multiples (price-earnings ratio, price-sales ratio, price-book ratio and price-to-free cash flow) that the stock has traded at.
A GuruFocus adjustment factor based on the company's past returns and growth.
Future estimates of business performance from Morningstar analysts.
Exactly how the GF Value is calculated is not disclosed. While in my short experience it is a fine measure with good predictability, the lack of transparency of the calculation methodology prevents it from being used outside of GuruFocus.
Earnings power value
Earning power value, or EPV, is based on the concept first popularized by Columbia University professor Bruce Greenblatt that one should value a stock based on the current operating profits of company and not on future projections, which may or may not come true. Some argue it is a better though conservative way to analyze stocks than discounted cash flow analysis, which relies on highly speculative growth assumptions projected many years into the future. The main assumption for EPV is that the current profitability is sustainable. I find this method useful for assessing value stocks with little or no growth, but for stocks which rely on growth, it is pretty much useless.
Applying the EPV method to Procter & Gamble and Goodyear, we find little if any predictive power for this method in valuing the two companies. This method would have prevented us from buying P&G over the last 25 years and given false results on Goodyear by indicating a buy in years when it would not have been prudent and a sell when the stock was undervalued.
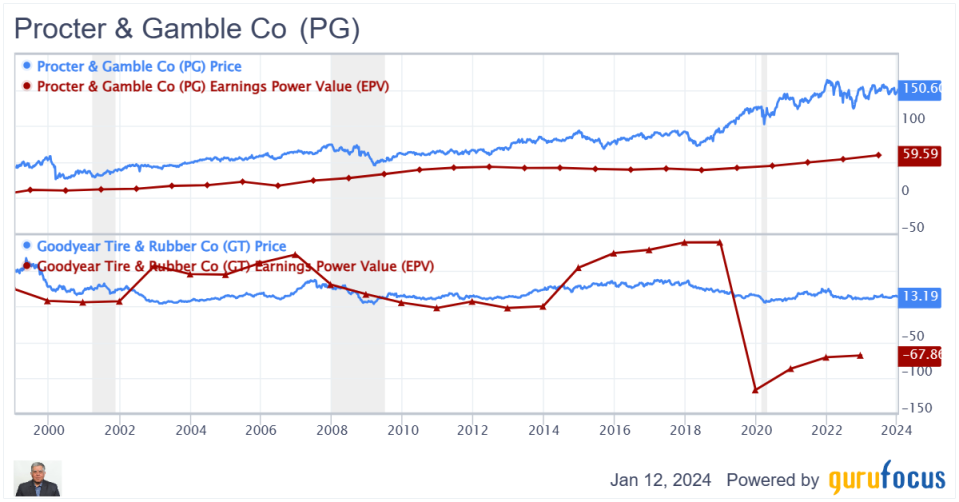
PG Data by GuruFocus
Discounted cash flow method
Probably the most popular method of valuation used by more sophisticated investors who have graduated from using price-earnings and PEG ratios, the discounted cash flow (DCF) method is a technique used to estimate the value of an investment based on its expected future cash flows. It involves discounting the projected cash flows (or earnings) back to their present value using a chosen discount rate, such as the weighted average cost of capital. The DCF method helps investors assess the potential profitability of an investment while accounting for the time value of money.
DCF models can become quite complex, but this does not make them better. GuruFocus, for example offers a two-stage valuation model in its DCF calculator, which can use GAAP earnings or free cash flow as a starting point . The major input in GuruFocus' calculator is the choice of starting value, growth rates and discount rates. We will notice that small changes in assumption of these variables can have a big impact on the final valuation. Thus, investors get the results they want by playing around with the variables, which limits the usefulness of this technique. Too much skepticism and conservatism will make us miss opportunity and too much optimism will cause us to make mistakes. Errors are inevitable as we are projecting decades into the future. In the end, DCF, like other valuation techniques, is a tool and the utility of a tool depends on the skill we use it with. Just because we give an amateur a power saw does not make him into a carpenter. He can easily hurt himself.
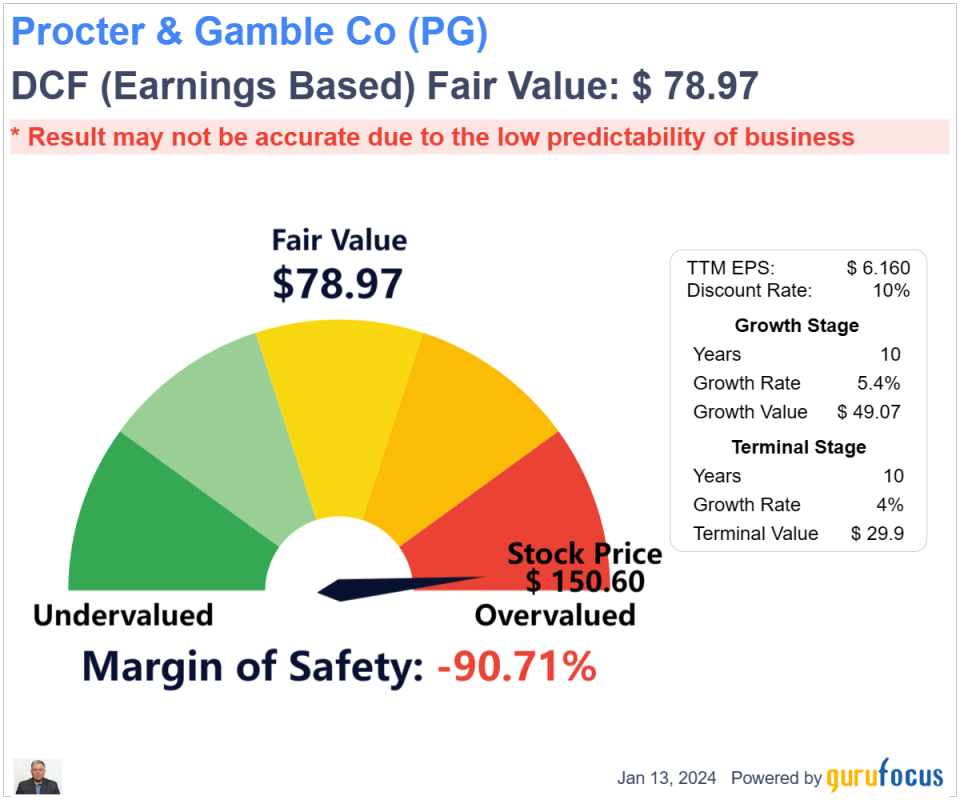
Below is a valuation of Procter & Gamble using the default inputs. The model says the stock is very overvalued. I can, of course, play around with the model and get whatever value I want. Frankly, this becomes an exercise in self-justification.
Projected FCF
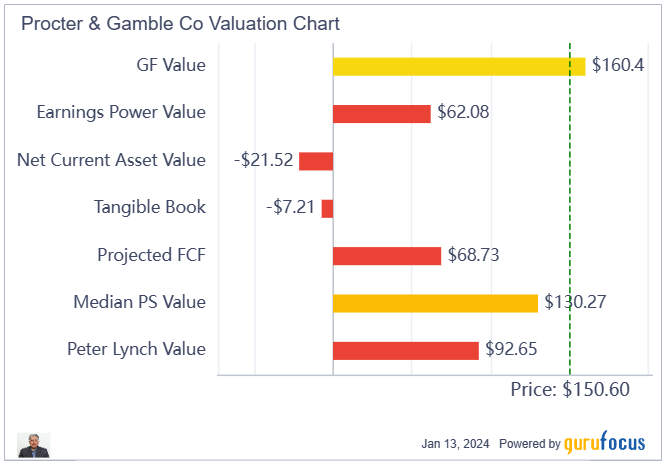
Another model which is available as part of GuruFocus' valuation panel is the projected free cash flow methodology. According to GuruFocus, since the DCF intrinsic value calculations are based on free cash flow or earnings, it cannot be applied to companies without consistent revenue and earnings. GuruFocus developed the projected FCF valuation model based on the normalized free cash flow and book value of the company. How it calculates the intrinsic value of stocks is described in detail here. Essentially, the method takes 80% of the book value and adds it to the present value of free cash flow averaged over six years. So in essence, it's another variation of the DCF model. Looking at Procter & Gamble's valuation using this method, we see it appears to undervalue the stock.
The same thing can be said for Goodyear's projected value.
I find the projected free cash flow is more useful in cases where company's business is capital intensive and cyclical and book value is a crucial component.
Simple value and growth factors
In thinking about growth and value and my aversion to over-paying, I have been pondering on how to come up with a single measure which can incorporate both. How do you balance the two attributes and reconcile with the price of the stock?
I devised a technique that I am sharing below. The technique involves reducing the value and growth attributes of the stock into a common scale which I call "factors."
The technique has three steps. First, calculate the value factor. Second, calculate the growth factor. Third, add the value and growth factors together. The higher the total, the better. I will break these steps down further.
First, derive the value factor by calculating the value of a stock with respect to a risk-free 10-year U.S. government bond. For instance:
Value factor = Operating profits/ (enterprise value 10-year U.S. treasury bond rate)
The logic of the formula is as follows:
Numerator: Operating profits are the pre-tax profits a company generates (for this exercise we ignore taxes).
Denominator: The enterprise value is the logical value an external buyer would pay for the entire company on the open market. This includes market capitalization minus debt plus cash. Multiplying enterprise value by the 10-year treasury rate gives us the risk-free return an investor would get if was to invest the entire amount in 10-year U.S. treasury bonds.
Basically, you want the operating profit of the company to be higher than the amount you would get if you were to invest the same amount in Treasuries, which are risk free. You obviously want to be paid more than the risk-free rate. The higher the factor, the better. Note this does not take into account growth of operating profit and enterprise value. Therefore, it is a conservative estimate. Here are some examples.
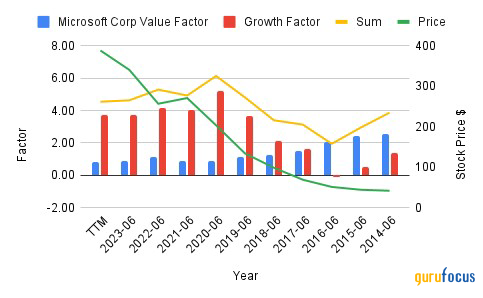
Looking at Microsoft (NASDAQ:MSFT), at present you can get 13% better risk-free income from 10-year U.S. T-bills, while with Verizon (NYSE:VZ), you can get 116% more income as compared to the same bonds. This income is not the same as a dividend as a portion of this is retained earnings and also does not include taxes. Hot stock Nvidia (NASDAQ:NVDA) is, of course, growing very fast and you may well decide the low factor of safety does not matter in the long run. But you are making this decision with eyes wide open. Same with Exxon (NYSE:XOM); while the factor of value is very high at present, it may be temporary given the high price of oil and it may well evaporate in the years to come.
For step two, the growth factor is calculated as the five-year Ebitda growth rate per share divided by the growth divider.
Breaking it down further:
Numerator: Ebitda, or earnings before interest, taxes, depreciation and amortization, is a measure of a company's profitability and efficiency. Growing Ebitda is important for business owners and investors because it indicates an improvement in the company's performance and earnings per share. It also demonstrates the company's worth and attractiveness to potential investors. It also allows for a fair comparison of different companies with different capital structure, debt and tax profiles. Further, it separates revenue from other expenses and shows the core profitability of a business. It forms a middle ground between revenue growth and net income growth, so I find it more consistent and useful than either. The five-year period for Ebitda growth allows us sufficient time to get a consistent or secular growth number, though a shorter period might be more appropriate for cyclical businesses. For the purpose of this excercise, I will stick to five years.
Denominator: Here this technique gets a little judgmental and arbitrary. I had to come up with a divisor which would give me a "weight" for each point of Ebitda growth. By trial and error, I found that a divider of 5 gives me decent results. Therefore, in this system, each five percentage points of Ebitda growth ( i.e., one growth factor) is equivalent to one value factor. Therefore, a company with a five-year Ebitda growth profile of 10% will give us a growth factor of 2 and so on.
For step three, we simply add the growth and value factors together to get a single number. The higher the number, the better.
Let us start with the Nvidia, which is the stock du jour. The company's operating income for the trailing 12 months is $20.61 billion, while the current enterprise value is $1.34 trillion, the five-year Ebitda growth rate is 19.4%, 10-year Treasury yield is 3.94% and the growth divider is 5. Putting all this together, we get the following:
Value factor = 20613/(1343984.2*3.94/100) = 0.3893
Growth factor = 19.4/5=3.88
Sum = 0.38+3.88=4.26
Therefore, I find that Nvidia's growth factor is very high and more than makes up for the low value factor, making for a very good combined value and growth factor. This makes Nvidia a strong buy by this technique.
The following chart show Nvidia's value (blue bar), growth (red bar) and sum (combined, yellow line) factors over the last 10 years. The stock price is shown as a green line and plotted on the right vertical axis. Nvidia was showing signs of being a great buy as early as 2015, which became pretty clear by 2017 and the sum reached a peak in 2019, when the stock price was still quite low. Interestingly enough, the stock still looks like a buy with a combined factor value over 4, obviously because of its extraordinary growth.

Here is a similar chart for Microsoft, which also shows that it is still a buy (with a combined value and growth factor score of over 4) even after an epic run-up.
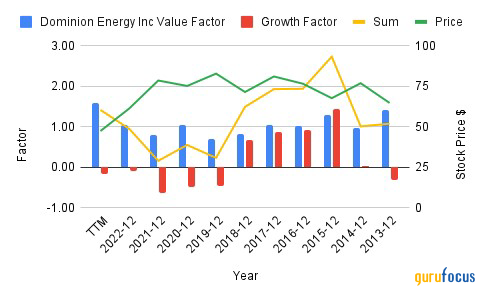
Here is a similar chart for Dominion (NYSE:D), a beaten down utility. While the combined factor is now over 1, it had very low growth factor. Overall, this is a hold, but is probably OK for value investors who are not looking for growth.
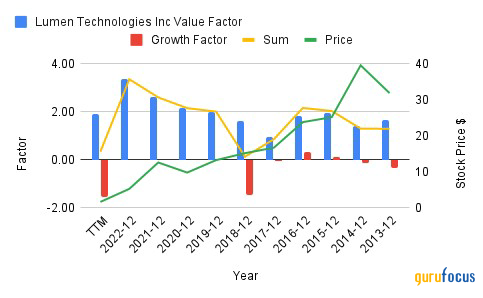
Lumen Technologies (NYSE:LUMN) looks like a stock to avoid or sell. While the value factor is good, the growth factor is deeply negative. It looks like a melting icecube. At the very least, wait until the growth factor starts to reverse.
Overall, I find the simple value and growth factor method intuitive and reasonably predictable, as well as a useful addition to my valuation toolbox. It brings structure to the two most important attributes of price and helps seperate the signal from the noise.
Conclusion
There are many other valuation techniques such as the Graham number and enterprise value/Ebitda that are also of limited value in specific situations which I won't bother discussing.
Given the plethora of valuation techniques available, valuation is more of an art than a science. I think most experienced investors tend to use multiple techniques and then trigulate them to arrive at a value they think is fair and with which they feel comfortable. It is important to have a lattice work of mental models and be able to filter your ideas through them. Most of the ideas will be discarded and only a few remain.
As Munger said, What makes investment hard is that [on one hand] it's easy to see that some companies have better businesses than others, but [on the other hand] the price of the stock goes up so high that all of a sudden, the question of which stock is the best to buy gets quite difficult. We've never eliminated the difficulty of that problem.
Munger and Buffett addressed this problem by practicing extreme patience in waiting for the right "fat pitch." They are not afraid to let suboptimal pitches go by (in investing, unlike baseball, there is no compulsion to swing). However, when a fat pitch does arrive, they swing aggresively and decisively to hit the ball outside the park.
This article first appeared on GuruFocus.
