Zicom Group Limited’s (ASX:ZGL) Investment Returns Are Lagging Its Industry

Today we'll look at Zicom Group Limited (ASX:ZGL) and reflect on its potential as an investment. To be precise, we'll consider its Return On Capital Employed (ROCE), as that will inform our view of the quality of the business.
First up, we'll look at what ROCE is and how we calculate it. Next, we'll compare it to others in its industry. Then we'll determine how its current liabilities are affecting its ROCE.
Understanding Return On Capital Employed (ROCE)
ROCE is a metric for evaluating how much pre-tax income (in percentage terms) a company earns on the capital invested in its business. All else being equal, a better business will have a higher ROCE. Ultimately, it is a useful but imperfect metric. Author Edwin Whiting says to be careful when comparing the ROCE of different businesses, since 'No two businesses are exactly alike.'
How Do You Calculate Return On Capital Employed?
Analysts use this formula to calculate return on capital employed:
Return on Capital Employed = Earnings Before Interest and Tax (EBIT) ÷ (Total Assets - Current Liabilities)
Or for Zicom Group:
0.031 = S$2.2m ÷ (S$121m - S$51m) (Based on the trailing twelve months to June 2019.)
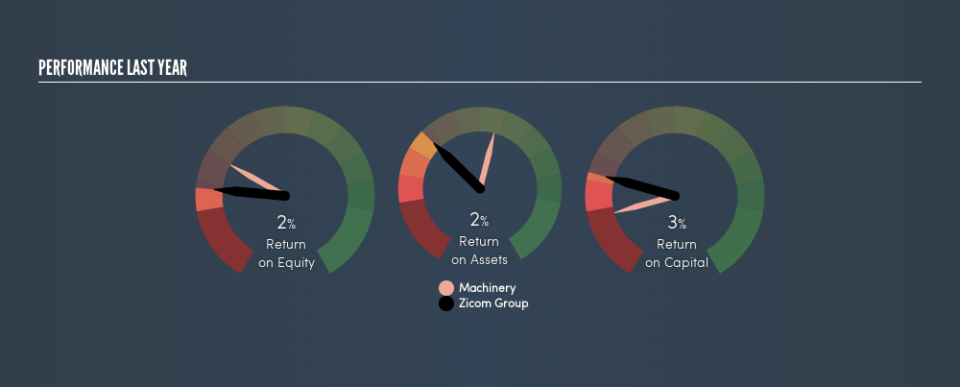
Therefore, Zicom Group has an ROCE of 3.1%.
Check out our latest analysis for Zicom Group
Does Zicom Group Have A Good ROCE?
ROCE can be useful when making comparisons, such as between similar companies. In this analysis, Zicom Group's ROCE appears meaningfully below the 9.1% average reported by the Machinery industry. This performance could be negative if sustained, as it suggests the business may underperform its industry. Regardless of how Zicom Group stacks up against its industry, its ROCE in absolute terms is quite low (especially compared to a bank account). It is likely that there are more attractive prospects out there.
Zicom Group has an ROCE of 3.1%, but it didn't have an ROCE 3 years ago, since it was unprofitable. That suggests the business has returned to profitability. You can click on the image below to see (in greater detail) how Zicom Group's past growth compares to other companies.
When considering ROCE, bear in mind that it reflects the past and does not necessarily predict the future. ROCE can be misleading for companies in cyclical industries, with returns looking impressive during the boom times, but very weak during the busts. This is because ROCE only looks at one year, instead of considering returns across a whole cycle. If Zicom Group is cyclical, it could make sense to check out this free graph of past earnings, revenue and cash flow.
Zicom Group's Current Liabilities And Their Impact On Its ROCE
Liabilities, such as supplier bills and bank overdrafts, are referred to as current liabilities if they need to be paid within 12 months. The ROCE equation subtracts current liabilities from capital employed, so a company with a lot of current liabilities appears to have less capital employed, and a higher ROCE than otherwise. To check the impact of this, we calculate if a company has high current liabilities relative to its total assets.
Zicom Group has total assets of S$121m and current liabilities of S$51m. Therefore its current liabilities are equivalent to approximately 42% of its total assets. With a medium level of current liabilities boosting the ROCE a little, Zicom Group's low ROCE is unappealing.
What We Can Learn From Zicom Group's ROCE
There are likely better investments out there. But note: make sure you look for a great company, not just the first idea you come across. So take a peek at this free list of interesting companies with strong recent earnings growth (and a P/E ratio below 20).
For those who like to find winning investments this free list of growing companies with recent insider purchasing, could be just the ticket.
We aim to bring you long-term focused research analysis driven by fundamental data. Note that our analysis may not factor in the latest price-sensitive company announcements or qualitative material.
If you spot an error that warrants correction, please contact the editor at editorial-team@simplywallst.com. This article by Simply Wall St is general in nature. It does not constitute a recommendation to buy or sell any stock, and does not take account of your objectives, or your financial situation. Simply Wall St has no position in the stocks mentioned. Thank you for reading.
