
Stocks got smoked on Monday, extending last week’s sell-off, which was already the worst week since 2016.
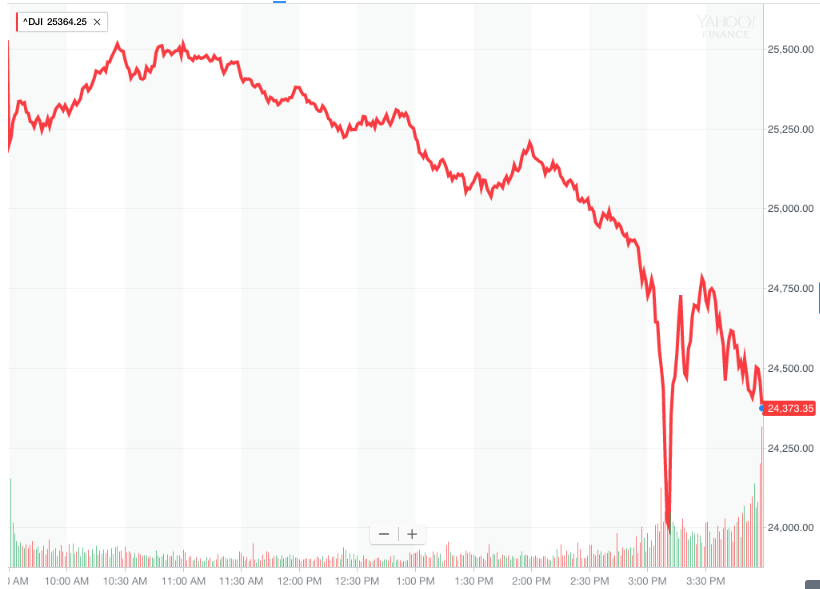
After a wild start to the trading day that saw markets open deep in the red before rallying to turn positive, markets slid again throughout the afternoon with the Dow losing as much as 1,597 points by mid-afternoon.
Monday marked the largest single-day decline for the blue chip index on a points basis, though the percentage losses seen Monday are far from the worst in the Dow’s history.
After the dust settled, the Dow closed down 1,175 points, or 4.6%, while the S&P 500 closed down 113 points or 4.1%. The tech heavy Nasdaq shed 273 points, or 3.8%. This slide has sent the Dow below the 25,000 milestone, which it eclipsed for the first time in early January. The blue chip index is now negative for the year after having gained 6% in just the first few weeks of the year.
Monday’s losses on the Dow were led by Exxon Mobil (XOM), which was down 5.9%, and Chevron (CVX), down 5.4%. All 30 Dow components closed in the red.
The decline in stock market caught the attention of the Trump administration, which in a statement to CNBC’s Eamon Javers on Monday morning said, “We’re always concerned when the market loses any value, but we’re also confident in the economy’s fundamentals.”
The proximate cause of this latest market decline is the rise in Treasury yields this year that sent the benchmark 10-year yield to 2.85% last week, its highest level in four years. This comes just 18 months after the 10-year hit a record low. In afternoon trade on Monday, the 10-year was sitting near 2.81%.
Additionally, strong wage data last Friday from the Bureau of Labor Statistics saw markets brace for more aggressive interest rate hikes from the Federal Reserve in the year to come.

Low interest rates have, in part, been bolstering stock market valuations since the financial crisis. Back in October, Warren Buffett outlined why he still thought stocks were attractive given low Treasury yields. The 10-year yield is up 50 basis points since those comments.
Investors are also coming off a 15-month period following Donald Trump’s presidential election win in which markets were calm and returns were strong, and yet a creeping skepticism about the market had become a more common discussion among investors.
Yahoo Finance’s Dion Rabouin on Monday rounded up some of the common themes making investors nervous right now, which notably includes questions over whether cutting taxes at this stage in the economic recovery was a prudent move from the Trump administration. “The issue is, did tax reform kill the bull market or is tax reform a fiscal policy mistake? That’s what the market is struggling with,” Nicholas Colas, co-founder at DataTrek Research, told Yahoo Finance.
Still, most analysts expect that the recent decline in stocks will be short-lived given the solid economic and earnings fundamentals that have bolstered the case for owning stocks over the last year.
“We see last week as a reset in asset valuations with market expectations for rates moving closer to the Fed dots, not the start of a new correlation regime,” writes Keith Parker, a strategist at UBS. “When economic data surprises have been positive, equity pullbacks have averaged 5%, suggesting last week’s 4% selloff is close to an end. Selloffs have averaged 9% when data surprised have been very negative.”
In a note to clients published Sunday, Stephen Suttmeier, a technical analyst with Bank of America Merrill Lynch, said to “mind the downside gaps on the S&P 500. They are indisputable and resistance on rallies.”
Bespoke Investment Group highlighted in a note Monday morning that despite the downward pressure we’ve seen in the market over the last few trading sessions, S&P 500 futures are still not at their 50-day moving average. The 50-day moving average is an intermediate-term trend line for the market and large deviations from this level are expected to resolve back to the mean in time.
—
Myles Udland is a writer at Yahoo Finance. Follow him on Twitter @MylesUdland
Read more from Myles here:
One candidate for Amazon’s next headquarters looks like a clear frontrunner
Tax cuts are going to keep being a boon for the shareholder class
Auto sales declined for the first time since the financial crisis in 2017
Foreign investors might be the key to forecasting a U.S. recession
It’s been 17 years since U.S. consumers felt this good about the economy
