Unveiling Public Service Enterprise Group (PEG)'s Value: Is It Really Priced Right? A ...
Public Service Enterprise Group Inc (NYSE:PEG) has seen a daily gain of 1.5%, contrasting with a 3-month loss of -3.74%. The company's Earnings Per Share (EPS) stands at 5.56. With these figures, the question arises: is the stock modestly undervalued? This article explores the valuation analysis of Public Service Enterprise Group, providing valuable insights for potential investors.
Company Overview
Public Service Enterprise Group is a holding company with diversified business operations. It has a regulated utility, PSE&G, and non-regulated businesses such as nuclear power generation and clean energy projects. PSE&G delivers regulated gas and electricity services to a combined 4 million customers in New Jersey. The company also operates the Long Island Power Authority system. In 2022, it sold its gas and oil power plants in the Mid-Atlantic, New York, and the Northeast. With a stock price of $59.55, the company's market cap stands at $29.70 billion. This article aims to analyze if this price aligns with the company's intrinsic value, as estimated by the GF Value.

Understanding the GF Value
The GF Value is a proprietary measure that estimates a stock's intrinsic value. It's computed considering historical trading multiples, a GuruFocus adjustment factor based on past performance and growth, and future business performance estimates. The GF Value Line represents the ideal fair trading value of the stock. If the stock price is significantly above the GF Value Line, it is overvalued and its future return is likely to be poor. Conversely, if it is significantly below the GF Value Line, its future return will likely be higher.
According to GuruFocus' valuation method, the stock of Public Service Enterprise Group (NYSE:PEG) is estimated to be modestly undervalued. This suggests that the long-term return of its stock is likely to be higher than its business growth.

Link: These companies may deliver higher future returns at reduced risk.
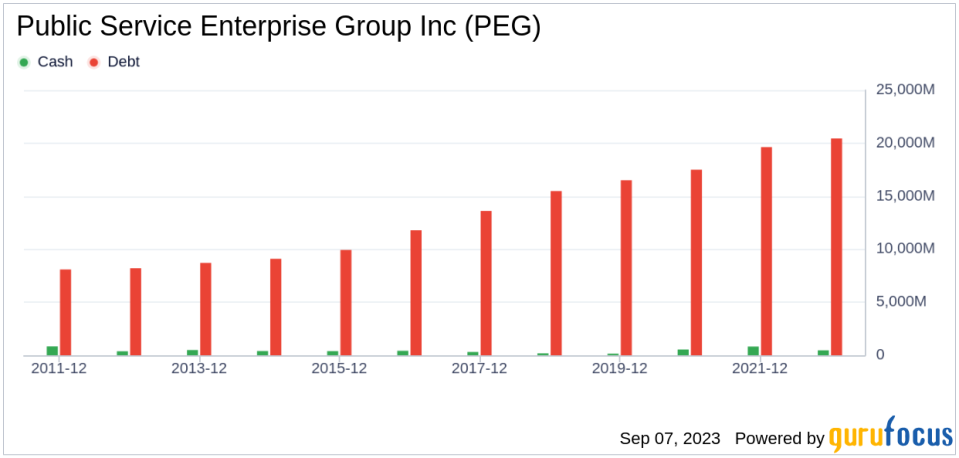
Financial Strength Analysis
Investing in companies with poor financial strength can lead to a higher risk of permanent capital loss. Hence, it's crucial to carefully review a company's financial strength before deciding to invest in its stock. Public Service Enterprise Group's cash-to-debt ratio of 0.03 is worse than 88.31% of companies in the Utilities - Regulated industry. This indicates that the overall financial strength of Public Service Enterprise Group is poor.
Profitability and Growth
Investing in profitable companies, especially those with consistent profitability over the long term, is usually less risky. Public Service Enterprise Group has been profitable 9 over the past 10 years. Its operating margin is 31.62%, ranking better than 88.91% of companies in the Utilities - Regulated industry. This indicates fair profitability.
Growth is a crucial factor in the valuation of a company. The 3-year average annual revenue growth of Public Service Enterprise Group is -0.5%, which ranks worse than 83.75% of companies in the Utilities - Regulated industry. The 3-year average EBITDA growth rate is -9.5%, ranking worse than 84.03% of companies in the industry. This suggests poor growth.
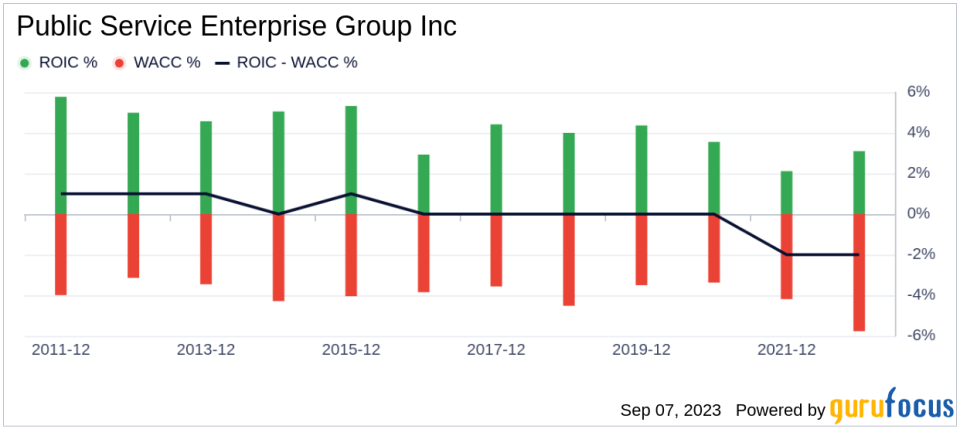
ROIC vs WACC
Comparing a company's return on invested capital (ROIC) to the weighted average cost of capital (WACC) is another way to determine its profitability. The ROIC measures how well a company generates cash flow relative to the capital it has invested in its business. The WACC is the rate that a company is expected to pay on average to all its security holders to finance its assets. When the ROIC is higher than the WACC, it implies the company is creating value for shareholders. For the past 12 months, Public Service Enterprise Group's ROIC is 6.06, and its WACC is 5.31.
Conclusion
In conclusion, the stock of Public Service Enterprise Group (NYSE:PEG) is estimated to be modestly undervalued. The company's financial condition is poor, and its profitability is fair. Its growth ranks worse than 84.03% of 457 companies in the Utilities - Regulated industry. To learn more about Public Service Enterprise Group stock, you can check out its 30-Year Financials here.
To find out the high-quality companies that may deliver above-average returns, please check out the GuruFocus High Quality Low Capex Screener.
This article first appeared on GuruFocus.
