
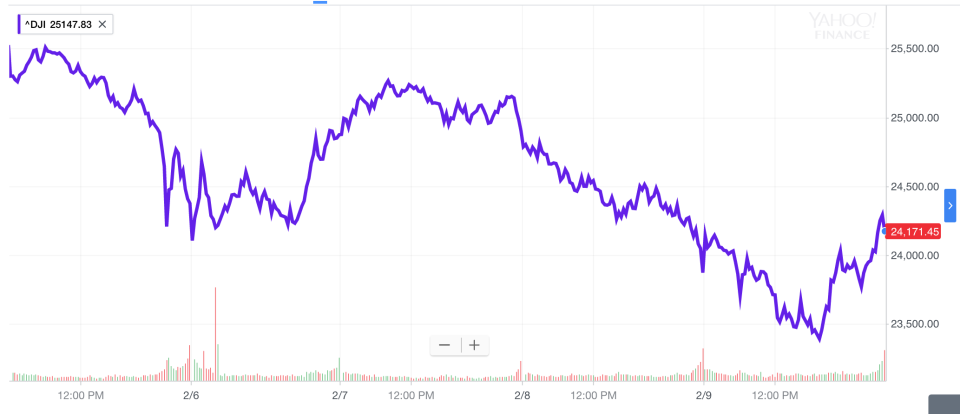
This past week was a wild one for the stock market.
Each of the major U.S. averages lost more than 5% with the Dow losing more than 1,000 points in a single day twice. Despite a more than 1% rally to cap the week on Friday, each of the Dow, S&P 500, and Nasdaq lost 5.2%. It was the worst week since January 2016.
Monday’s sell-off, which was the largest point decline in the Dow’s history as the blue chip index shed 1,175 points, was chaotic and disorienting. And by week’s end, both investors and those not steeped in financial markets were left asking the same question — what just happened?
It all starts with the January jobs report
Perhaps the most frustrating part of this week’s action is that unlike declines around the debt ceiling in 2011, or concerns over the Chinese economy in 2015, or post-Brexit and post-election market sell-offs seen in 2016, there was no one thing you could point to and say, “This is what made markets go down.”
A number of factors were at play in markets this week, some of which seem more potent than others, and all of which contributed to the hectic trading. But the chaos seen this past week really begins the week before last.
On Friday, February 2, the January jobs report was released and showed that more jobs were added to the economy than expected during the first month of the year while wage growth was also stronger than expected.
Coming at the end of a week that saw Treasury yields continue to move to multi-year highs, strong wage data was seen by many as confirming bond market fears that inflation is coming to the U.S. economy this year.
In turn, markets started to believe the Federal Reserve would have to be more aggressive in raising interest rates in 2018 and beyond. The increase in interest rates that had been seen since the start of 2018, all at once, became a primary concern for the stock market. Stocks sold off hard into the weekend. (Notably, interest rates stayed elevated during this week’s market sell-off, indicating no fundamental re-rating of how investors see the economic playing field — wage growth, inflation, and a more aggressive Fed are still baked in.)
The post-jobs-report market stress continued into Monday. And this is when the “higher rates” trade became the “higher volatility” trade.
The VIX index, which tracks current and expected market volatility, spiked higher as the week’s first trading day drew to an end. In 2017, the VIX hit a record low of 8.64. By Monday afternoon the index was at 50. This surge in volatility — both realized and expected — led to the implosion of an exchange-traded fund designed to help investors bet against volatility. One of the trendiest trades of 2017 was reversed almost overnight.
When trading closed on Monday, the stock market was down about 4% with the Dow falling 1,175 points and Treasuries did not prove to be the safe haven many expect them to be in a market storm. With this kind of market action breaking out, it became clear that worries over inflation were a weak excuse for a wholesale panic in markets. Something else was going on.
And concerns over a Credit Suisse-sponsored fund — the VelocityShares Daily Inverse VIX Short Term exchange-traded note, which trades under the ticker XIV — and the broader volatility in markets impacted shares of Credit Suisse (CS), which fell 8% this week, as well as the Cboe (CBOE), which houses the VIX index. Shares of Cboe lost over 20% this week.
JP Morgan’s Marko Kolanovic wrote late Monday that, “Today’s large increase of market volatility will clearly contribute to further outflows from systematic strategies in the days ahead.” For the rest of the week, “the computers” being in charge would be an often-heard — if perhaps misguided — theme about what besides higher rates was driving markets.
Wall Street hunkers down
Wall Street strategists, however, were adamant that Monday’s decline was not the beginning of a bear market or a sign that something in the economic or earnings picture had changed.
“I think that the setback [on Monday] is not over but we are approaching a bottom,” Scott Minerd, CIO at Guggenheim, wrote in a note Tuesday. “This correction is a healthy development for the markets in the long run, and the equity bull market, while bloodied, is not broken.”
RBC Capital Markets said in a note Tuesday that, “For now, we are buyers on the dip.” Deutsche Asset Management told its high-net worth clients said Tuesday, “We maintain our positive outlook for most equity markets and do not expect bond yields to continue to rise at their recent pace.”
But as markets sought to regain footing after Monday’s jarring trade, the new volatility regime now facing investors now in itself became a reason to sell stocks and be risk-averse. George Soros’ idea that markets are driven by reflexivity, or trends that become self-fulfilling, was now out in full force. Volatility created fears of more volatility which lead to more market volatility.
Another thousand points
On Tuesday, the Dow opened down 560 points before closing up 560 points. This unsettled trading action was a clear sign that markets were not giving an all-clear sign, no matter the assurances from the Wall Street intelligentsia. Boring markets were officially gone.
Wednesday saw markets swing wildly before an largely unchanged finish. And then on Thursday, the Dow lost 1,000 points for the second time in four days. Thursday’s drop sent the Dow and the S&P 500 officially into correction territory, defined as a 10% drop from recent highs.
On Thursday afternoon, Rich Barry, floor governor at the New York Stock Exchange, said the sell-off “has reached a point where traders are asking the following questions: Is this just another healthy correction in a long-running secular bull market? Have we seen the bottom yet?”
When investors ask about the bottom in stocks, it’s clear we’re not there yet.
And after Thursday’s close, commentary about the violent selling we’d seen in just a handful of days — Bespoke Investment Group noted that the 10.04% drop in the S&P 500 is the benchmark index’s largest nine-day drop from an all-time high since 1980 — began to take on a more cautious tone when it came to the prior certainty that this would all be over soon.

Friday capped the week with another wild day of trading as the Dow traded up, then down, then back up in a hectic final hour of trading. Early Friday afternoon the Dow and the S&P 500 touched their 200-day moving average, a technical indicator that roughly captures the market’s prevailing trend. Sustained moves below or above the 200-day is seen as a sign of a new, long-term regime coming to markets. A bounce higher off this can be seen as bulls maintaining some control over the market.
But as we head into next week’s trading, it is clear that the choppiness seen in markets over last 10 trading days has not been resolved. The question now is not about when markets will get “back to normal,” but whether the newly realized instability investors are facing will impact the real economy.
“We may have seen a glimpse in the last couple of weeks of how the cycle may end,” said Paul Mortimer-Lee, chief market economist and head of U.S. economics at BNP Paribas.
“A large asset price correction may damage the functioning of markets, impeding the flow of funds from savers to end investors, thereby reducing investment and increasing savings. Lower asset prices may result in substantially higher savings ratios – especially in the US – damping activity severely and feeding back into asset prices.
“Like the last two recessions, an asset price bust may be the trigger for the next downturn. The recent stock price fall may not turn into a major heart attack, but it is always wise to take note of angina. Something is badly amiss.”
—
Myles Udland is a writer at Yahoo Finance. Follow him on Twitter @MylesUdland
Read more from Myles here:
One candidate for Amazon’s next headquarters looks like a clear frontrunner
Tax cuts are going to keep being a boon for the shareholder class
Auto sales declined for the first time since the financial crisis in 2017
Foreign investors might be the key to forecasting a U.S. recession
It’s been 17 years since U.S. consumers felt this good about the economy
